47 min read
Food Prices Analysis in Kenya (2007-2025)
Analyzing 18 years of food price trends across Kenya using data science
Analyzing 18 years of food price trends across Kenya using data science
This is the connection link to my database on postgreSQL, the actual connection function is on the file db_connect.py
# Import necessary packages
import pandas as pd
from db_connect import connect_to_db

# Step 1: Connect to the database
conn = connect_to_db()

# Step 2: Create a cursor and run a query
cursor = conn.cursor()
query = "SELECT * FROM food_prices_cleaned.food_prices_kenya;"
cursor.execute(query)

# Step 3: Fetch results and convert to a DataFrame
rows = cursor.fetchall()
df = pd.DataFrame(rows, columns=[desc[0] for desc in cursor.description])

# Step 4: Display the data
print("Connection successful! Previewing data:")
display(df.head(25))
Database connection successful!
Connection successful! Previewing data:| provinces | counties | mkt_name | latitude | longitude | geo_id | price_date | year | month | components | ... | l_potatoes | c_potatoes | inflation_potatoes | trust_potatoes | o_food_price_index | h_food_price_index | l_food_price_index | c_food_price_index | inflation_food_price_index | trust_food_price_index | |
|---|---|---|---|---|---|---|---|---|---|---|---|---|---|---|---|---|---|---|---|---|---|
| 0 | North Eastern | Garissa | Alango Arba | -0.1 | 39.99 | gid_-1000000399900000 | 1/1/2007 | 2007 | 1 | beans (1 KG, Index Weight = 1), maize (1 KG, I... | ... | 1172.65 | 1214.63 | NaN | 5.4 | 0.49 | 0.50 | 0.47 | 0.49 | NaN | 9.1 |
| 1 | North Eastern | Garissa | Alango Arba | -0.1 | 39.99 | gid_-1000000399900000 | 2/1/2007 | 2007 | 2 | beans (1 KG, Index Weight = 1), maize (1 KG, I... | ... | 1175.46 | 1197.46 | NaN | 5.4 | 0.48 | 0.50 | 0.47 | 0.48 | NaN | 9.1 |
| 2 | North Eastern | Garissa | Alango Arba | -0.1 | 39.99 | gid_-1000000399900000 | 3/1/2007 | 2007 | 3 | beans (1 KG, Index Weight = 1), maize (1 KG, I... | ... | 1147.22 | 1147.22 | NaN | 5.4 | 0.47 | 0.48 | 0.45 | 0.45 | NaN | 9.1 |
| 3 | North Eastern | Garissa | Alango Arba | -0.1 | 39.99 | gid_-1000000399900000 | 4/1/2007 | 2007 | 4 | beans (1 KG, Index Weight = 1), maize (1 KG, I... | ... | 1095.18 | 1159.48 | NaN | 5.4 | 0.44 | 0.46 | 0.43 | 0.46 | NaN | 9.1 |
| 4 | North Eastern | Garissa | Alango Arba | -0.1 | 39.99 | gid_-1000000399900000 | 5/1/2007 | 2007 | 5 | beans (1 KG, Index Weight = 1), maize (1 KG, I... | ... | 1138.89 | 1176.51 | NaN | 5.4 | 0.47 | 0.48 | 0.46 | 0.46 | NaN | 9.1 |
| 5 | North Eastern | Garissa | Alango Arba | -0.1 | 39.99 | gid_-1000000399900000 | 6/1/2007 | 2007 | 6 | beans (1 KG, Index Weight = 1), maize (1 KG, I... | ... | 1154.62 | 1184.45 | NaN | 5.4 | 0.45 | 0.47 | 0.44 | 0.47 | NaN | 9.1 |
| 6 | North Eastern | Garissa | Alango Arba | -0.1 | 39.99 | gid_-1000000399900000 | 7/1/2007 | 2007 | 7 | beans (1 KG, Index Weight = 1), maize (1 KG, I... | ... | 1160.40 | 1187.24 | NaN | 5.4 | 0.47 | 0.48 | 0.46 | 0.47 | NaN | 9.1 |
| 7 | North Eastern | Garissa | Alango Arba | -0.1 | 39.99 | gid_-1000000399900000 | 8/1/2007 | 2007 | 8 | beans (1 KG, Index Weight = 1), maize (1 KG, I... | ... | 1158.50 | 1193.78 | NaN | 5.4 | 0.47 | 0.48 | 0.45 | 0.47 | NaN | 9.1 |
| 8 | North Eastern | Garissa | Alango Arba | -0.1 | 39.99 | gid_-1000000399900000 | 9/1/2007 | 2007 | 9 | beans (1 KG, Index Weight = 1), maize (1 KG, I... | ... | 1168.62 | 1195.18 | NaN | 5.4 | 0.47 | 0.48 | 0.46 | 0.47 | NaN | 9.1 |
| 9 | North Eastern | Garissa | Alango Arba | -0.1 | 39.99 | gid_-1000000399900000 | 10/1/2007 | 2007 | 10 | beans (1 KG, Index Weight = 1), maize (1 KG, I... | ... | 1165.66 | 1188.42 | NaN | 5.4 | 0.47 | 0.48 | 0.46 | 0.47 | NaN | 9.1 |
| 10 | North Eastern | Garissa | Alango Arba | -0.1 | 39.99 | gid_-1000000399900000 | 11/1/2007 | 2007 | 11 | beans (1 KG, Index Weight = 1), maize (1 KG, I... | ... | 1156.61 | 1248.76 | NaN | 5.4 | 0.47 | 0.51 | 0.45 | 0.51 | NaN | 9.1 |
| 11 | North Eastern | Garissa | Alango Arba | -0.1 | 39.99 | gid_-1000000399900000 | 12/1/2007 | 2007 | 12 | beans (1 KG, Index Weight = 1), maize (1 KG, I... | ... | 1208.29 | 1208.29 | NaN | 5.4 | 0.54 | 0.58 | 0.52 | 0.58 | NaN | 9.1 |
| 12 | North Eastern | Garissa | Alango Arba | -0.1 | 39.99 | gid_-1000000399900000 | 1/1/2008 | 2008 | 1 | beans (1 KG, Index Weight = 1), maize (1 KG, I... | ... | 1157.56 | 1287.63 | 6.01 | 5.4 | 0.62 | 0.63 | 0.60 | 0.63 | 29.25 | 9.1 |
| 13 | North Eastern | Garissa | Alango Arba | -0.1 | 39.99 | gid_-1000000399900000 | 2/1/2008 | 2008 | 2 | beans (1 KG, Index Weight = 1), maize (1 KG, I... | ... | 1301.20 | 1304.50 | 8.94 | 5.4 | 0.66 | 0.68 | 0.64 | 0.67 | 40.28 | 9.1 |
| 14 | North Eastern | Garissa | Alango Arba | -0.1 | 39.99 | gid_-1000000399900000 | 3/1/2008 | 2008 | 3 | beans (1 KG, Index Weight = 1), maize (1 KG, I... | ... | 1276.05 | 1348.77 | 17.57 | 5.4 | 0.69 | 0.71 | 0.67 | 0.67 | 47.49 | 9.1 |
| 15 | North Eastern | Garissa | Alango Arba | -0.1 | 39.99 | gid_-1000000399900000 | 4/1/2008 | 2008 | 4 | beans (1 KG, Index Weight = 1), maize (1 KG, I... | ... | 1342.67 | 1442.09 | 24.37 | 5.4 | 0.67 | 0.69 | 0.65 | 0.67 | 43.14 | 9.1 |
| 16 | North Eastern | Garissa | Alango Arba | -0.1 | 39.99 | gid_-1000000399900000 | 5/1/2008 | 2008 | 5 | beans (1 KG, Index Weight = 1), maize (1 KG, I... | ... | 1451.52 | 1599.98 | 35.99 | 5.4 | 0.67 | 0.71 | 0.65 | 0.71 | 56.56 | 9.1 |
| 17 | North Eastern | Garissa | Alango Arba | -0.1 | 39.99 | gid_-1000000399900000 | 6/1/2008 | 2008 | 6 | beans (1 KG, Index Weight = 1), maize (1 KG, I... | ... | 1649.88 | 1689.73 | 42.66 | 5.4 | 0.74 | 0.76 | 0.72 | 0.73 | 56.03 | 9.1 |
| 18 | North Eastern | Garissa | Alango Arba | -0.1 | 39.99 | gid_-1000000399900000 | 7/1/2008 | 2008 | 7 | beans (1 KG, Index Weight = 1), maize (1 KG, I... | ... | 1688.77 | 1706.34 | 43.72 | 5.4 | 0.74 | 0.79 | 0.72 | 0.79 | 69.91 | 9.1 |
| 19 | North Eastern | Garissa | Alango Arba | -0.1 | 39.99 | gid_-1000000399900000 | 8/1/2008 | 2008 | 8 | beans (1 KG, Index Weight = 1), maize (1 KG, I... | ... | 1676.26 | 1678.12 | 40.57 | 5.4 | 0.82 | 0.85 | 0.80 | 0.83 | 77.14 | 9.1 |
| 20 | North Eastern | Garissa | Alango Arba | -0.1 | 39.99 | gid_-1000000399900000 | 9/1/2008 | 2008 | 9 | beans (1 KG, Index Weight = 1), maize (1 KG, I... | ... | 1620.27 | 1723.69 | 44.22 | 5.4 | 0.85 | 0.88 | 0.83 | 0.84 | 79.54 | 9.1 |
| 21 | North Eastern | Garissa | Alango Arba | -0.1 | 39.99 | gid_-1000000399900000 | 10/1/2008 | 2008 | 10 | beans (1 KG, Index Weight = 1), maize (1 KG, I... | ... | 1708.71 | 1759.42 | 48.05 | 5.4 | 0.85 | 0.92 | 0.83 | 0.92 | 97.57 | 9.1 |
| 22 | North Eastern | Garissa | Alango Arba | -0.1 | 39.99 | gid_-1000000399900000 | 11/1/2008 | 2008 | 11 | beans (1 KG, Index Weight = 1), maize (1 KG, I... | ... | 1730.03 | 1818.37 | 45.61 | 5.4 | 0.96 | 0.99 | 0.94 | 0.94 | 81.81 | 9.1 |
| 23 | North Eastern | Garissa | Alango Arba | -0.1 | 39.99 | gid_-1000000399900000 | 12/1/2008 | 2008 | 12 | beans (1 KG, Index Weight = 1), maize (1 KG, I... | ... | 1807.36 | 1847.46 | 52.90 | 5.4 | 0.95 | 0.98 | 0.84 | 0.84 | 44.29 | 9.1 |
| 24 | North Eastern | Garissa | Alango Arba | -0.1 | 39.99 | gid_-1000000399900000 | 1/1/2009 | 2009 | 1 | beans (1 KG, Index Weight = 1), maize (1 KG, I... | ... | 1812.60 | 1817.62 | 41.16 | 5.4 | 0.80 | 0.83 | 0.77 | 0.83 | 31.46 | 9.1 |
25 rows × 34 columns
Data Exploration with Python, tryna get to understand my data
df.info()<class 'pandas.core.frame.DataFrame'>
RangeIndex: 41400 entries, 0 to 41399
Data columns (total 34 columns):
# Column Non-Null Count Dtype
--- ------ -------------- -----
0 provinces 41400 non-null object
1 counties 41400 non-null object
2 mkt_name 41400 non-null object
3 latitude 41400 non-null float64
4 longitude 41400 non-null float64
5 geo_id 41400 non-null object
6 price_date 41400 non-null object
7 year 41400 non-null int64
8 month 41400 non-null int64
9 components 41400 non-null object
10 o_beans 41400 non-null float64
11 h_beans 41400 non-null float64
12 l_beans 41400 non-null float64
13 c_beans 41400 non-null float64
14 inflation_beans 39192 non-null float64
15 trust_beans 41400 non-null float64
16 o_maize 41400 non-null float64
17 h_maize 41400 non-null float64
18 l_maize 41400 non-null float64
19 c_maize 41400 non-null float64
20 inflation_maize 39192 non-null float64
21 trust_maize 41400 non-null float64
22 o_potatoes 41400 non-null float64
23 h_potatoes 41400 non-null float64
24 l_potatoes 41400 non-null float64
25 c_potatoes 41400 non-null float64
26 inflation_potatoes 39192 non-null float64
27 trust_potatoes 41400 non-null float64
28 o_food_price_index 41400 non-null float64
29 h_food_price_index 41400 non-null float64
30 l_food_price_index 41400 non-null float64
31 c_food_price_index 41400 non-null float64
32 inflation_food_price_index 39192 non-null float64
33 trust_food_price_index 41400 non-null float64
dtypes: float64(26), int64(2), object(6)
memory usage: 10.7+ MBdf.describe()| latitude | longitude | year | month | o_beans | h_beans | l_beans | c_beans | inflation_beans | trust_beans | ... | l_potatoes | c_potatoes | inflation_potatoes | trust_potatoes | o_food_price_index | h_food_price_index | l_food_price_index | c_food_price_index | inflation_food_price_index | trust_food_price_index | |
|---|---|---|---|---|---|---|---|---|---|---|---|---|---|---|---|---|---|---|---|---|---|
| count | 41400.000000 | 41400.000000 | 41400.00000 | 41400.000000 | 41400.000000 | 41400.000000 | 41400.000000 | 41400.000000 | 39192.000000 | 41400.000000 | ... | 41400.000000 | 41400.000000 | 39192.000000 | 41400.000000 | 41400.000000 | 41400.000000 | 41400.000000 | 41400.000000 | 39192.000000 | 41400.000000 |
| mean | 0.938696 | 37.579239 | 2015.88000 | 6.440000 | 98.168466 | 102.572487 | 93.781520 | 98.177126 | 9.031954 | 9.145188 | ... | 1981.099405 | 2060.098150 | 8.249555 | 5.495944 | 0.987793 | 1.022464 | 0.953249 | 0.988657 | 9.395280 | 9.142923 |
| std | 2.219824 | 1.897270 | 5.41353 | 3.434145 | 27.899955 | 28.637733 | 26.989826 | 27.611295 | 28.478154 | 0.185153 | ... | 529.491075 | 547.465454 | 25.442221 | 0.449740 | 0.291554 | 0.298071 | 0.283049 | 0.288419 | 27.203402 | 0.177494 |
| min | -4.660000 | 34.360000 | 2007.00000 | 1.000000 | 21.690000 | 24.480000 | 20.640000 | 22.050000 | -50.370000 | 9.100000 | ... | 319.050000 | 380.120000 | -70.540000 | 5.400000 | 0.320000 | 0.350000 | 0.310000 | 0.330000 | -45.150000 | 9.100000 |
| 25% | -0.325000 | 35.967500 | 2011.00000 | 3.000000 | 81.240000 | 85.190000 | 77.230000 | 81.280000 | -8.300000 | 9.100000 | ... | 1650.070000 | 1715.710000 | -9.172500 | 5.400000 | 0.810000 | 0.840000 | 0.780000 | 0.810000 | -8.360000 | 9.100000 |
| 50% | 0.970000 | 37.320000 | 2016.00000 | 6.000000 | 97.310000 | 101.630000 | 92.870000 | 97.230000 | 1.590000 | 9.100000 | ... | 1941.540000 | 2013.820000 | 3.730000 | 5.400000 | 0.960000 | 1.000000 | 0.930000 | 0.960000 | 2.480000 | 9.100000 |
| 75% | 2.502500 | 39.572500 | 2021.00000 | 9.000000 | 113.000000 | 117.600000 | 108.130000 | 112.890000 | 22.340000 | 9.100000 | ... | 2243.167500 | 2334.785000 | 22.300000 | 5.400000 | 1.140000 | 1.180000 | 1.100000 | 1.140000 | 24.540000 | 9.100000 |
| max | 4.620000 | 41.860000 | 2025.00000 | 12.000000 | 215.440000 | 225.520000 | 200.290000 | 213.290000 | 135.880000 | 10.000000 | ... | 5105.320000 | 5671.570000 | 404.810000 | 10.000000 | 2.260000 | 2.350000 | 2.080000 | 2.130000 | 113.280000 | 10.000000 |
8 rows × 28 columns
Divide potatoes price columns by 50 to standardize to price per 1kg I choose to do this on derived columns to avoid confusion, or incase i’ll need the original data in future.
df['o_potatoes_1kg'] = df['o_potatoes'] / 50
df['h_potatoes_1kg'] = df['h_potatoes'] / 50
df['l_potatoes_1kg'] = df['l_potatoes'] / 50
df['c_potatoes_1kg'] = df['c_potatoes'] / 50df.info()<class 'pandas.core.frame.DataFrame'>
RangeIndex: 41400 entries, 0 to 41399
Data columns (total 38 columns):
# Column Non-Null Count Dtype
--- ------ -------------- -----
0 provinces 41400 non-null object
1 counties 41400 non-null object
2 mkt_name 41400 non-null object
3 latitude 41400 non-null float64
4 longitude 41400 non-null float64
5 geo_id 41400 non-null object
6 price_date 41400 non-null object
7 year 41400 non-null int64
8 month 41400 non-null int64
9 components 41400 non-null object
10 o_beans 41400 non-null float64
11 h_beans 41400 non-null float64
12 l_beans 41400 non-null float64
13 c_beans 41400 non-null float64
14 inflation_beans 39192 non-null float64
15 trust_beans 41400 non-null float64
16 o_maize 41400 non-null float64
17 h_maize 41400 non-null float64
18 l_maize 41400 non-null float64
19 c_maize 41400 non-null float64
20 inflation_maize 39192 non-null float64
21 trust_maize 41400 non-null float64
22 o_potatoes 41400 non-null float64
23 h_potatoes 41400 non-null float64
24 l_potatoes 41400 non-null float64
25 c_potatoes 41400 non-null float64
26 inflation_potatoes 39192 non-null float64
27 trust_potatoes 41400 non-null float64
28 o_food_price_index 41400 non-null float64
29 h_food_price_index 41400 non-null float64
30 l_food_price_index 41400 non-null float64
31 c_food_price_index 41400 non-null float64
32 inflation_food_price_index 39192 non-null float64
33 trust_food_price_index 41400 non-null float64
34 o_potatoes_1kg 41400 non-null float64
35 h_potatoes_1kg 41400 non-null float64
36 l_potatoes_1kg 41400 non-null float64
37 c_potatoes_1kg 41400 non-null float64
dtypes: float64(30), int64(2), object(6)
memory usage: 12.0+ MBRenaming some columns for better understanding of what they represent
import pandas as pd

def rename_agric_columns(df):
    """
    Renames columns like o_beans, h_beans, c_maize, etc.
    to a consistent format such as beans_open, maize_high, etc.
    """
    rename_map = {}
    prefix_map = {
        'o': 'open',
        'h': 'high',
        'l': 'low',
        'c': 'close'
    }

    # Iterate through existing columns
    for col in df.columns:
        # Check for trading-style prefixes (o_, h_, l_, c_)
        for prefix, new_prefix in prefix_map.items():
            if col.startswith(f"{prefix}_"):
                # Example: o_beans → beans_open
                rename_map[col] = f"{col.split('_', 1)[1]}_{new_prefix}"
                break
        # Handle inflation_* and trust_* as is
        if col.startswith("inflation_") or col.startswith("trust_"):
            rename_map[col] = col  # keep same (optional)

    # Apply renaming
    df = df.rename(columns=rename_map)
    return df
df = rename_agric_columns(df)df.columnsIndex(['provinces', 'counties', 'mkt_name', 'latitude', 'longitude', 'geo_id',
'price_date', 'year', 'month', 'components', 'beans_open', 'beans_high',
'beans_low', 'beans_close', 'inflation_beans', 'trust_beans',
'maize_open', 'maize_high', 'maize_low', 'maize_close',
'inflation_maize', 'trust_maize', 'potatoes_open', 'potatoes_high',
'potatoes_low', 'potatoes_close', 'inflation_potatoes',
'trust_potatoes', 'food_price_index_open', 'food_price_index_high',
'food_price_index_low', 'food_price_index_close',
'inflation_food_price_index', 'trust_food_price_index',
'potatoes_1kg_open', 'potatoes_1kg_high', 'potatoes_1kg_low',
'potatoes_1kg_close'],
dtype='object')In this step i’m grouping the data by province, then ordering it by year: This keeps all rows but arranges them so that: All rows from the same province are grouped together Within each province, data appears in chronological order
df = df.sort_values(['provinces', 'year']).reset_index(drop=True)
df| provinces | counties | mkt_name | latitude | longitude | geo_id | price_date | year | month | components | ... | food_price_index_open | food_price_index_high | food_price_index_low | food_price_index_close | inflation_food_price_index | trust_food_price_index | potatoes_1kg_open | potatoes_1kg_high | potatoes_1kg_low | potatoes_1kg_close | |
|---|---|---|---|---|---|---|---|---|---|---|---|---|---|---|---|---|---|---|---|---|---|
| 0 | Central | Nyeri | Karatina (Nyeri) | -0.48 | 37.13 | gid_-4800000371300000 | 1/1/2007 | 2007 | 1 | beans (1 KG, Index Weight = 1), maize (1 KG, I... | ... | 0.47 | 0.48 | 0.45 | 0.47 | NaN | 9.1 | 24.4760 | 24.8922 | 23.5994 | 24.4304 |
| 1 | Central | Nyeri | Karatina (Nyeri) | -0.48 | 37.13 | gid_-4800000371300000 | 2/1/2007 | 2007 | 2 | beans (1 KG, Index Weight = 1), maize (1 KG, I... | ... | 0.47 | 0.48 | 0.45 | 0.46 | NaN | 9.1 | 24.2006 | 24.8458 | 23.5554 | 23.9514 |
| 2 | Central | Nyeri | Karatina (Nyeri) | -0.48 | 37.13 | gid_-4800000371300000 | 3/1/2007 | 2007 | 3 | beans (1 KG, Index Weight = 1), maize (1 KG, I... | ... | 0.45 | 0.47 | 0.43 | 0.43 | NaN | 9.1 | 23.6996 | 24.3288 | 23.0176 | 23.0176 |
| 3 | Central | Nyeri | Karatina (Nyeri) | -0.48 | 37.13 | gid_-4800000371300000 | 4/1/2007 | 2007 | 4 | beans (1 KG, Index Weight = 1), maize (1 KG, I... | ... | 0.42 | 0.44 | 0.41 | 0.44 | NaN | 9.1 | 22.5254 | 23.1288 | 21.9222 | 23.0490 |
| 4 | Central | Nyeri | Karatina (Nyeri) | -0.48 | 37.13 | gid_-4800000371300000 | 5/1/2007 | 2007 | 5 | beans (1 KG, Index Weight = 1), maize (1 KG, I... | ... | 0.45 | 0.46 | 0.43 | 0.44 | NaN | 9.1 | 23.1008 | 23.7028 | 22.4988 | 23.6062 |
| ... | ... | ... | ... | ... | ... | ... | ... | ... | ... | ... | ... | ... | ... | ... | ... | ... | ... | ... | ... | ... | ... |
| 41395 | Rift Valley | Samburu | Wamba | 0.98 | 37.32 | gid_9800000373200000 | 5/1/2025 | 2025 | 5 | beans (1 KG, Index Weight = 1), maize (1 KG, I... | ... | 1.31 | 1.35 | 1.28 | 1.35 | 4.22 | 9.1 | 58.1402 | 60.2166 | 56.0638 | 59.9014 |
| 41396 | Rift Valley | Samburu | Wamba | 0.98 | 37.32 | gid_9800000373200000 | 6/1/2025 | 2025 | 6 | beans (1 KG, Index Weight = 1), maize (1 KG, I... | ... | 1.37 | 1.41 | 1.34 | 1.35 | 5.67 | 9.1 | 60.7188 | 62.8504 | 58.5870 | 59.9462 |
| 41397 | Rift Valley | Samburu | Wamba | 0.98 | 37.32 | gid_9800000373200000 | 7/1/2025 | 2025 | 7 | beans (1 KG, Index Weight = 1), maize (1 KG, I... | ... | 1.36 | 1.39 | 1.28 | 1.28 | 5.13 | 9.1 | 59.9174 | 62.0312 | 57.5610 | 57.5610 |
| 41398 | Rift Valley | Samburu | Wamba | 0.98 | 37.32 | gid_9800000373200000 | 8/1/2025 | 2025 | 8 | beans (1 KG, Index Weight = 1), maize (1 KG, I... | ... | 1.25 | 1.29 | 1.22 | 1.23 | -2.63 | 9.1 | 56.3176 | 60.1112 | 54.2932 | 60.1112 |
| 41399 | Rift Valley | Samburu | Wamba | 0.98 | 37.32 | gid_9800000373200000 | 9/1/2025 | 2025 | 9 | beans (1 KG, Index Weight = 1), maize (1 KG, I... | ... | 1.20 | 1.23 | 1.16 | 1.20 | -0.31 | 9.1 | 60.9484 | 63.0852 | 58.8118 | 58.8740 |
41400 rows × 38 columns
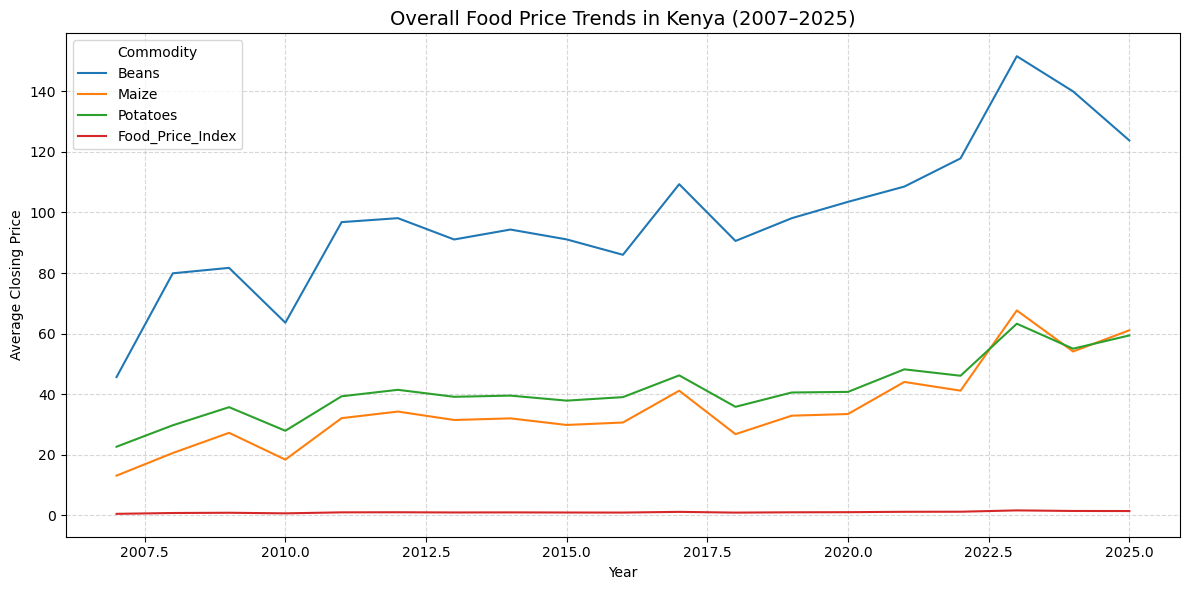
What are the overall trends in food prices (beans, maize, potatoes, and the food price index) across Kenya over the years (2007–2025)?
We want to see how prices have changed over time, for each commodity across all regions. That means we’ll probably focus on averages per year (national trend), not per province yet.
We’ll start by calculating the mean closing price for each commodity per year:
yearly_trends = df.groupby('year')[['beans_close','maize_close','potatoes_1kg_close','food_price_index_close']].mean().reset_index()
yearly_trends| year | beans_close | maize_close | potatoes_1kg_close | food_price_index_close | |
|---|---|---|---|---|---|
| 0 | 2007 | 45.640113 | 13.079375 | 22.634065 | 0.461155 |
| 1 | 2008 | 79.911608 | 20.551902 | 29.716902 | 0.738066 |
| 2 | 2009 | 81.705702 | 27.219180 | 35.692530 | 0.819977 |
| 3 | 2010 | 63.598777 | 18.374216 | 27.903323 | 0.622885 |
| 4 | 2011 | 96.815100 | 32.067518 | 39.292747 | 0.953514 |
| 5 | 2012 | 98.124266 | 34.243551 | 41.427033 | 0.985353 |
| 6 | 2013 | 91.081843 | 31.461594 | 39.123011 | 0.916581 |
| 7 | 2014 | 94.363143 | 31.994601 | 39.510317 | 0.940403 |
| 8 | 2015 | 91.108315 | 29.816128 | 37.854715 | 0.900005 |
| 9 | 2016 | 86.025534 | 30.630245 | 39.013446 | 0.882500 |
| 10 | 2017 | 109.346952 | 41.139620 | 46.192669 | 1.115077 |
| 11 | 2018 | 90.596766 | 26.784538 | 35.813045 | 0.868587 |
| 12 | 2019 | 98.113379 | 32.881585 | 40.541108 | 0.972545 |
| 13 | 2020 | 103.517822 | 33.434588 | 40.744212 | 1.007391 |
| 14 | 2021 | 108.550648 | 44.024253 | 48.192428 | 1.138302 |
| 15 | 2022 | 117.875593 | 41.151698 | 46.073577 | 1.162708 |
| 16 | 2023 | 151.615557 | 67.641803 | 63.258623 | 1.601599 |
| 17 | 2024 | 139.988546 | 54.086662 | 55.008107 | 1.412133 |
| 18 | 2025 | 123.788587 | 61.091818 | 59.393267 | 1.384728 |
import matplotlib.pyplot as plt
import seaborn as sns

plt.figure(figsize=(12, 6))
sns.lineplot(data=yearly_trends, x='year', y='beans_close', label='Beans')
sns.lineplot(data=yearly_trends, x='year', y='maize_close', label='Maize')
sns.lineplot(data=yearly_trends, x='year', y='potatoes_1kg_close', label='Potatoes')
sns.lineplot(data=yearly_trends, x='year', y='food_price_index_close', label='Food_Price_Index')

plt.title('Overall Food Price Trends in Kenya (2007–2025)', fontsize=14)
plt.xlabel('Year')
plt.ylabel('Average Closing Price')
plt.legend(title='Commodity')
plt.grid(True, linestyle='--', alpha=0.5)
plt.tight_layout()
plt.show()
/home/kobey/anaconda3/envs/medium_article/lib/python3.10/site-packages/scipy/__init__.py:146: UserWarning: A NumPy version >=1.17.3 and <1.25.0 is required for this version of SciPy (detected version 1.26.4
warnings.warn(f"A NumPy version >={np_minversion} and <{np_maxversion}"
 overall foodprices in kenya(2007–2025)
All commodities beans, maize, and potatoes show a gradual increase in average prices from 2007 through around 2023, followed by a slight decline toward 2025.
This suggests long-term inflationary pressure on food prices in Kenya.
The blue line(Beans) remains well above maize and potatoes throughout the period. This likely reflects both higher production costs and strong demand for beans as a protein source
The Orange(maize) and green(Potatoes) line move roughly together, meaning price changes for one often coincide with the other This may reflect shared market influence like weather condition or fuel prices that affect all stable crops.
Even though its values are smaller in scale, the Food Price Index (red line) mirrors the general direction of the other commodities. It acts as a summary indicator of overall food inflation, showing peaks and troughs that align with the crops’ price changes.
There’s a sharp spike across all commodities around 2022–2023, likely due to global and local disruptions e.g., drought, COVID-19 aftereffects, global supply chain issues or elections. After this spike, prices dip slightly toward 2025, suggesting a partial recovery or stabilization.
There are two visible dips, around 2010 and 2018, across most commodities.
These years coincide with major election periods in Kenya (the 2010 constitutional referendum and the 2017 general election).
Such events often influence food prices through market disruptions, political uncertainty, and short-term policy changes that affect production and distribution.
monthly_trends = df.groupby(['year','month'])[['beans_close','maize_close','potatoes_1kg_close','food_price_index_close']].mean().reset_index()
monthly_trends| year | month | beans_close | maize_close | potatoes_1kg_close | food_price_index_close | |
|---|---|---|---|---|---|---|
| 0 | 2007 | 1 | 46.146848 | 13.203098 | 22.837568 | 0.466196 |
| 1 | 2007 | 2 | 44.950109 | 13.179891 | 22.827742 | 0.458750 |
| 2 | 2007 | 3 | 42.479076 | 12.173207 | 21.831339 | 0.433152 |
| 3 | 2007 | 4 | 44.402011 | 12.440870 | 22.138103 | 0.448098 |
| 4 | 2007 | 5 | 42.239457 | 12.872065 | 22.408171 | 0.439457 |
| ... | ... | ... | ... | ... | ... | ... |
| 220 | 2025 | 5 | 131.143587 | 63.099022 | 60.603499 | 1.444348 |
| 221 | 2025 | 6 | 131.127446 | 63.093913 | 60.597341 | 1.444239 |
| 222 | 2025 | 7 | 125.509891 | 60.347772 | 58.975321 | 1.388043 |
| 223 | 2025 | 8 | 108.025870 | 65.642065 | 62.114737 | 1.336630 |
| 224 | 2025 | 9 | 107.132174 | 63.510435 | 60.868936 | 1.312663 |
225 rows × 6 columns
import calendar

def month_to_name(x):
    # If it's an integer (1–12), convert to month name
    if isinstance(x, int):
        return calendar.month_name[x]
    # If it's already a string (e.g. "January"), keep it as is
    return x

monthly_trends['month'] = monthly_trends['month'].apply(month_to_name)# Make sure month names are properly formatted and ordered
month_order = list(calendar.month_name[1:])
# Convert month column to an ordered categorical type
monthly_trends['month'] = pd.Categorical(monthly_trends['month'],
categories=month_order,
ordered=True)
# pivot will respect that order
pivot = monthly_trends.pivot(index='year', columns='month', values='beans_close')
plt.figure(figsize=(10,6))
sns.heatmap(pivot, cmap='RdYlGn_r', annot=True, fmt=".1f")
plt.title('Seasonal Heatmap of Beans (Monthly Averages)')
plt.xlabel('Month')
plt.ylabel('Year')
plt.show()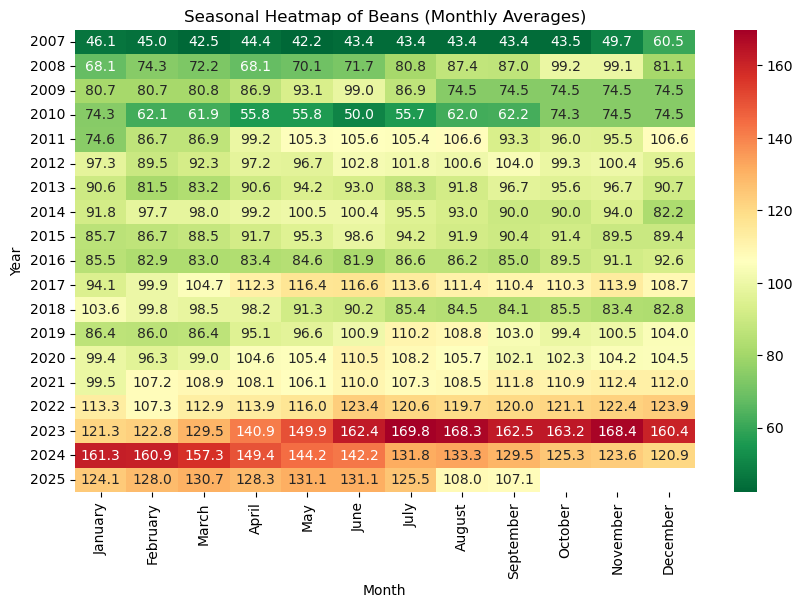 Heatmap of Beans (Monthly Averages)
# Make sure month names are properly formatted and ordered
month_order = list(calendar.month_name[1:])
# Convert month column to an ordered categorical type
monthly_trends['month'] = pd.Categorical(monthly_trends['month'],
categories=month_order,
ordered=True)
# pivot will respect that order
pivot = monthly_trends.pivot(index='year', columns='month', values='maize_close')
plt.figure(figsize=(10,6))
sns.heatmap(pivot, cmap='RdYlGn_r', annot=True, fmt=".1f")
plt.title('Seasonal Heatmap of Maize (Monthly Averages)')
plt.xlabel('Month')
plt.ylabel('Year')
plt.show()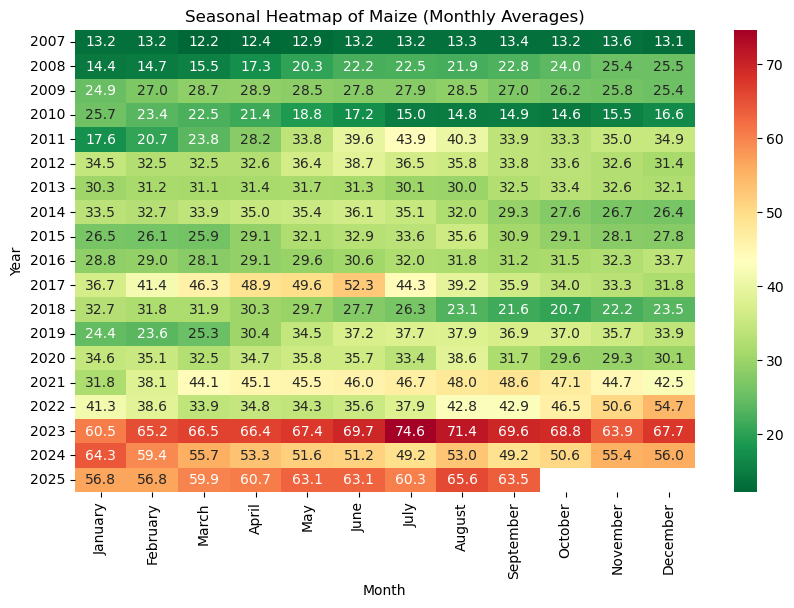 Heatmap of Maize(Monthly Averages)
# Make sure month names are properly formatted and ordered
month_order = list(calendar.month_name[1:])
# Convert month column to an ordered categorical type
monthly_trends['month'] = pd.Categorical(monthly_trends['month'],
categories=month_order,
ordered=True)
# pivot will respect that order
pivot = monthly_trends.pivot(index='year', columns='month', values='potatoes_1kg_close')
plt.figure(figsize=(10,6))
sns.heatmap(pivot, cmap='RdYlGn_r', annot=True, fmt=".1f")
plt.title('Seasonal Heatmap of Potatoes (Monthly Averages)')
plt.xlabel('Month')
plt.ylabel('Year')
plt.show()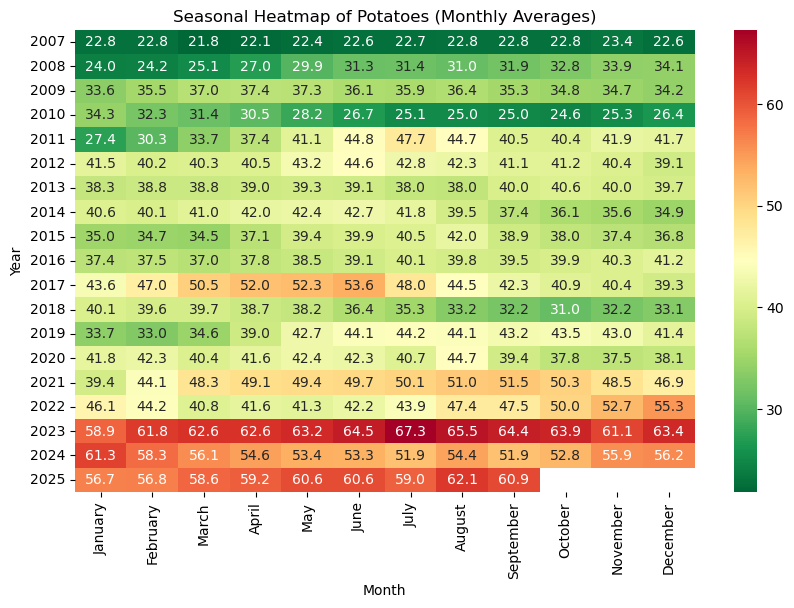 Heatmap of Potatoes (Monthly Averages)
import calendar
# Make sure month names are properly formatted and ordered
month_order = list(calendar.month_name[1:])
# Convert month column to an ordered categorical type
monthly_trends['month'] = pd.Categorical(monthly_trends['month'],
categories=month_order,
ordered=True)
# pivot will respect that order
pivot = monthly_trends.pivot(index='year', columns='month', values='food_price_index_close')
plt.figure(figsize=(10,6))
sns.heatmap(pivot, cmap='RdYlGn_r', annot=True, fmt=".1f")
plt.title('Seasonal Heatmap of Food Price Index (Monthly Averages)')
plt.xlabel('Month')
plt.ylabel('Year')
plt.show()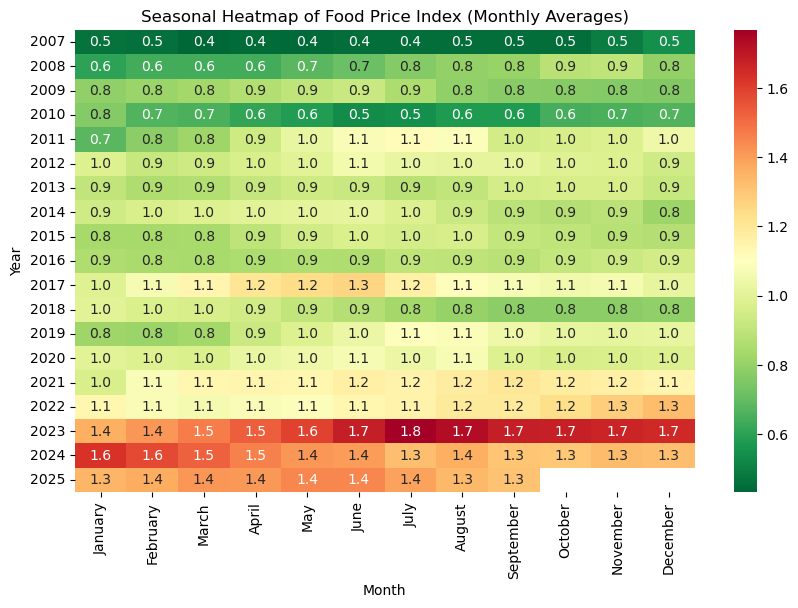 Food Price Index (Monthly Averages)
The color intensity deepens gradually from top to bottom, indicating that food prices have generally increased over the years. Earlier years (2007–2010) show light yellow-green colors (index ≈ 0.4–0.8), while recent years (2023–2025) show dark blue shades (index ≈ 1.3–1.7). Conclusion: There’s a clear long-term upward trend in food prices, reflecting inflation, cost of production, or other macroeconomic factors.
Prices tend to peak between May and August (darker shades). January to April often shows lighter colors, relatively lower food prices. September to December stabilizes or slightly cools off, depending on the year. Interpretation: This suggests seasonal price pressure mid-year, possibly linked to: Planting or lean seasons before harvest (reduced supply). Increased demand or transport challenges in those months. Conversely, lower prices early in the year may correspond to harvest periods when supply is abundant.
2023 shows the darkest overall colors (1.6–1.8 range), indicating exceptionally high prices likely due to inflationary pressures or external shocks (e.g., global food shortages, climate effects). 2010 and 2016 show relatively cooler colors even mid-year, meaning prices were comparatively stable during those periods. Conclusion: Prices have become consistently high but less seasonally volatile in recent years.
# Step 1: Group by provinces and year to get average closing prices per year
avg_prices_province = (
    df.groupby(['provinces','year'], as_index=False)[['beans_close', 'maize_close','potatoes_1kg_close','food_price_index_close']].mean()
)
avg_prices_province| provinces | year | beans_close | maize_close | potatoes_1kg_close | food_price_index_close | |
|---|---|---|---|---|---|---|
| 0 | Central | 2007 | 43.306667 | 14.065833 | 23.800267 | 0.459167 |
| 1 | Central | 2008 | 74.847500 | 22.003333 | 30.878350 | 0.724167 |
| 2 | Central | 2009 | 77.480833 | 29.358333 | 37.670917 | 0.819167 |
| 3 | Central | 2010 | 60.275833 | 19.687500 | 29.007200 | 0.617500 |
| 4 | Central | 2011 | 90.697500 | 34.045000 | 40.623267 | 0.937500 |
| ... | ... | ... | ... | ... | ... | ... |
| 128 | Rift Valley | 2021 | 109.717056 | 39.323788 | 45.220418 | 1.101429 |
| 129 | Rift Valley | 2022 | 116.934697 | 41.536439 | 46.611907 | 1.162565 |
| 130 | Rift Valley | 2023 | 151.666353 | 70.990249 | 65.547698 | 1.633874 |
| 131 | Rift Valley | 2024 | 140.577229 | 53.127662 | 54.740280 | 1.408344 |
| 132 | Rift Valley | 2025 | 124.888889 | 62.162035 | 60.351189 | 1.402525 |
133 rows × 6 columns
# Step 1: Reshape your data from wide to long format
price_columns = ['beans_close', 'maize_close', 'potatoes_1kg_close', 'food_price_index_close']
df_long = avg_prices_province.melt(
    id_vars=['provinces', 'year'],
    value_vars=price_columns,
    var_name='Commodity',
    value_name='Price'
)

print("--- Head of Reshaped (Long) Data ---")
print(df_long.head())
print("\n")

# 2. Plot the data using sns.relplot
sns.set_style("whitegrid")

# This creates a Figure-level plot that automatically handles faceting
g = sns.relplot(
    data=df_long,
    kind='line',          # Specify a line plot
    x='year',
    y='Price',
    hue='Commodity',      # Color lines by commodity
    col='provinces',      # Create columns for each province
    col_wrap=3,           # Wrap the columns after 3 plots
    height=3.5,           # Height of each individual plot
    aspect=1.5,           # Aspect ratio (width/height)
    legend='full'
)

# Step 3: Customize titles and labels
g.set_axis_labels('Year', 'Average Closing Price')
g.set_titles(col_template='{col_name}')
g.fig.suptitle('Food Price Trends by Province (2007–2025)', fontsize=16, y=1.03) # Add a main title

# 4. Save the figure
#plt.tight_layout()
plt.savefig('province_price_trends.png')

print("Faceted plot saved to 'province_price_trends.png'")
--- Head of Reshaped (Long) Data ---
provinces year Commodity Price
0 Central 2007 beans_close 43.306667
1 Central 2008 beans_close 74.847500
2 Central 2009 beans_close 77.480833
3 Central 2010 beans_close 60.275833
4 Central 2011 beans_close 90.697500
Faceted plot saved to 'province_price_trends.png'
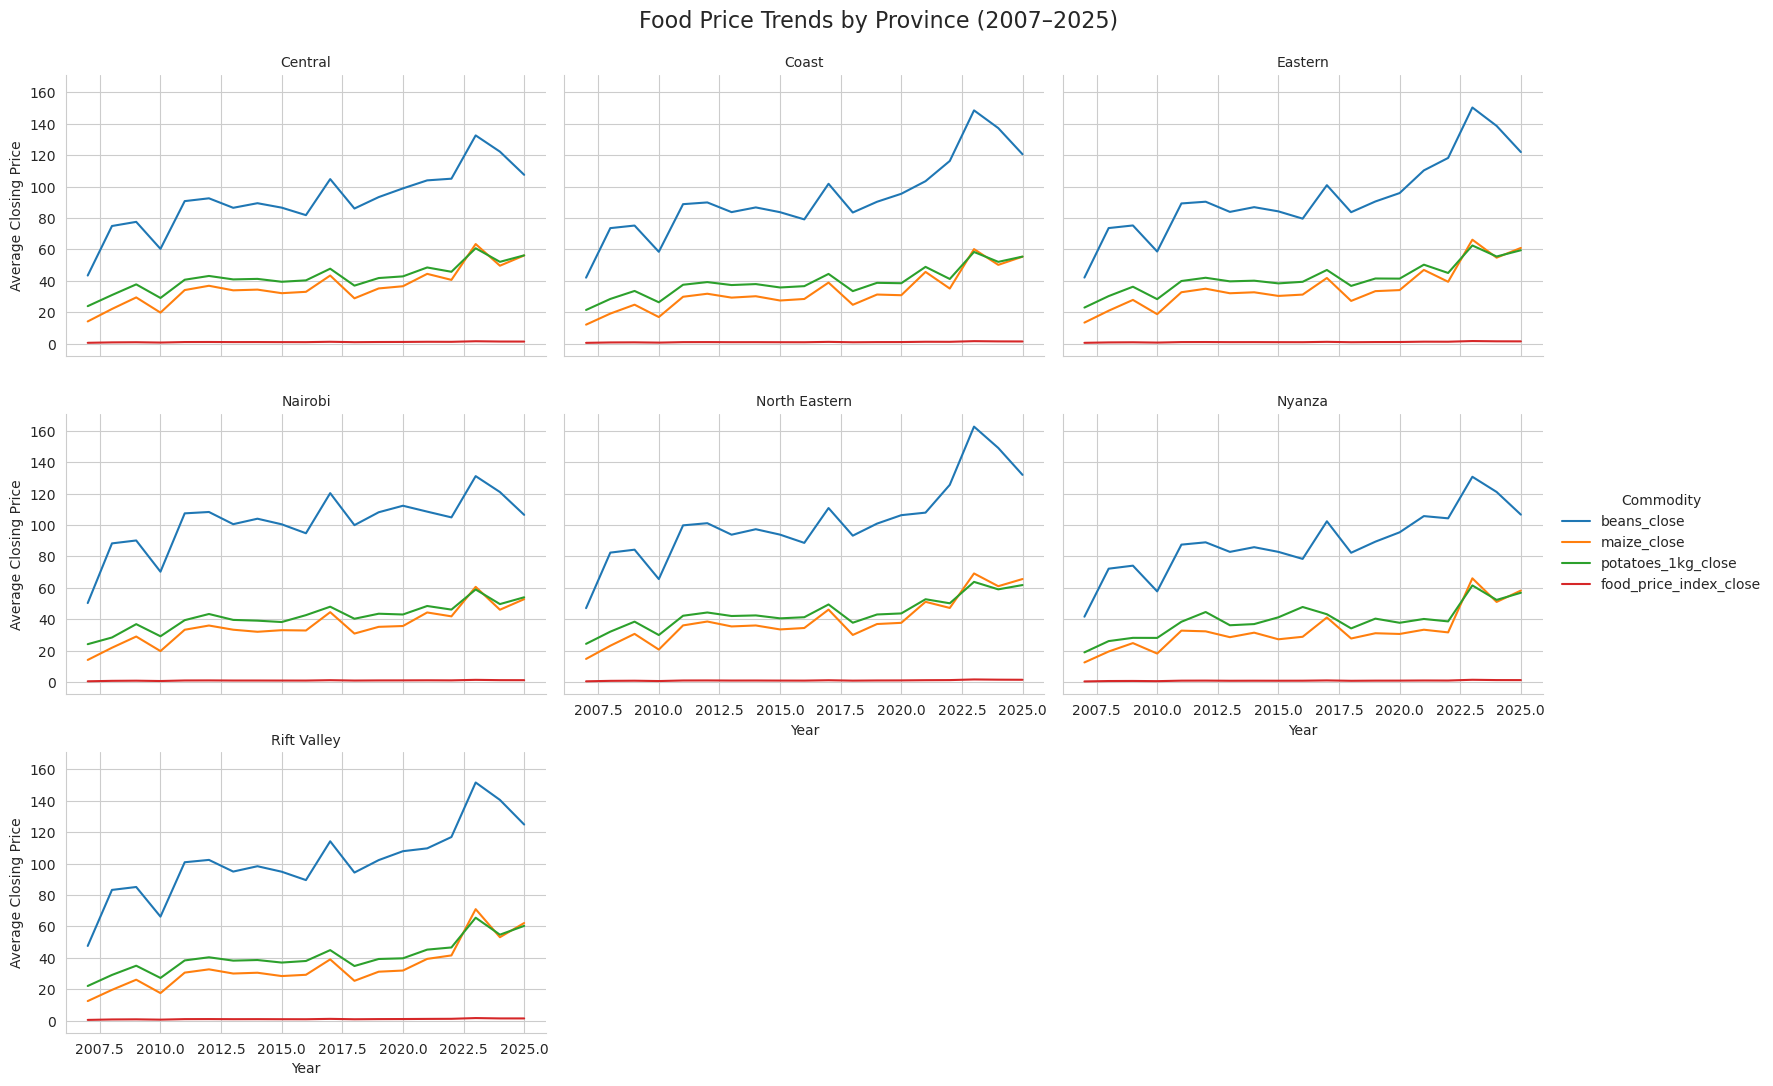 Food Price Trends by Province (2007–2025)
# Created a New Column average_food_price
avg_prices_province['avg_food_price'] = avg_prices_province[
   ['beans_close', 'maize_close', 'potatoes_1kg_close']
].mean(axis=1)# Compute the long-term average for each province
province_avg_overall = (
avg_prices_province.groupby('provinces', as_index=False)['avg_food_price']
.mean()
.sort_values(by='avg_food_price', ascending=False)
)
# Display results
print(province_avg_overall)
# Get the top province
top_province = province_avg_overall.iloc[0]
bottom_province = province_avg_overall.iloc[-1]
print(f"Province with consistently highest food price: {top_province['provinces']} ({top_province['avg_food_price']:.2f})")
print(f"Province with consistently lowest food price: {bottom_province['provinces']} ({bottom_province['avg_food_price']:.2f})")
       provinces  avg_food_price
4  North Eastern       61.944615
3        Nairobi       59.616837
6    Rift Valley       58.805979
2        Eastern       56.963456
0        Central       56.529800
1          Coast       54.771665
5         Nyanza       53.851025
Province with consistently highest food price: North Eastern (61.94)
Province with consistently lowest food price: Nyanza (53.85)# List of commodities to analyze
crops = ['beans_close', 'maize_close', 'potatoes_1kg_close', 'food_price_index_close']
for crop in crops:
crop_name = crop.replace('_close', '').capitalize()
print(f"\n🌾 Ranking of provinces by average {crop_name} price:\n")
# Compute average price per province
province_avg = (
avg_prices_province.groupby('provinces', as_index=False)[crop]
.mean()
.sort_values(by=crop, ascending=False)
)
# Print full ranking
for i, row in province_avg.iterrows():
print(f"{i+1}. {row['provinces']}: {row[crop]:.2f}")
# Identify top and bottom provinces
top = province_avg.iloc[0]
bottom = province_avg.iloc[-1]
# Print summary
print(f"\n🏆 Highest average {crop_name} price: {top['provinces']} ({top[crop]:.2f})")
print(f"💰 Lowest average {crop_name} price: {bottom['provinces']} ({bottom[crop]:.2f})")
print("-" * 60)🌾 Ranking of provinces by average Beans price:
5. North Eastern: 102.25
6. Nairobi: 101.45
7. Rift Valley: 101.34
8. Eastern: 93.33
9. Coast: 92.49
10. Central: 91.42
11. Nyanza: 88.98
🏆 Highest average Beans price: North Eastern (102.25)
💰 Lowest average Beans price: Nyanza (88.98)
------------------------------------------------------------
🌾 Ranking of provinces by average Maize price:
12. North Eastern: 39.39
13. Central: 36.14
14. Eastern: 35.71
15. Nairobi: 35.65
16. Rift Valley: 34.29
17. Nyanza: 33.01
18. Coast: 32.68
🏆 Highest average Maize price: North Eastern (39.39)
💰 Lowest average Maize price: Coast (32.68)
------------------------------------------------------------
🌾 Ranking of provinces by average Potatoes_1kg price:
19. North Eastern: 44.19
20. Central: 42.03
21. Eastern: 41.85
22. Nairobi: 41.74
23. Rift Valley: 40.78
24. Nyanza: 39.56
25. Coast: 39.15
🏆 Highest average Potatoes_1kg price: North Eastern (44.19)
💰 Lowest average Potatoes_1kg price: Coast (39.15)
------------------------------------------------------------
🌾 Ranking of provinces by average Food_price_index price:
26. North Eastern: 1.05
27. Nairobi: 1.01
28. Rift Valley: 1.00
29. Eastern: 0.97
30. Central: 0.96
31. Coast: 0.93
32. Nyanza: 0.92
🏆 Highest average Food_price_index price: North Eastern (1.05)
💰 Lowest average Food_price_index price: Nyanza (0.92)
------------------------------------------------------------# Step 2: Group by counties and year to get average closing prices per year
avg_prices_county = (
df.groupby(['counties','year'], as_index=False)[['beans_close', 'maize_close','potatoes_1kg_close','food_price_index_close']].mean()
)
avg_prices_county| counties | year | beans_close | maize_close | potatoes_1kg_close | food_price_index_close | |
|---|---|---|---|---|---|---|
| 0 | Baringo | 2007 | 39.981759 | 9.070648 | 18.166039 | 0.381111 |
| 1 | Baringo | 2008 | 69.886667 | 14.259815 | 24.055556 | 0.613148 |
| 2 | Baringo | 2009 | 71.460093 | 18.932685 | 28.765706 | 0.676019 |
| 3 | Baringo | 2010 | 55.676574 | 12.716296 | 22.336981 | 0.513889 |
| 4 | Baringo | 2011 | 83.811296 | 22.299167 | 31.651383 | 0.780648 |
| ... | ... | ... | ... | ... | ... | ... |
| 470 | West Pokot | 2021 | 106.917500 | 30.592917 | 38.749200 | 0.999583 |
| 471 | West Pokot | 2022 | 107.625000 | 38.933750 | 45.029183 | 1.085417 |
| 472 | West Pokot | 2023 | 138.033333 | 68.738750 | 64.208533 | 1.536667 |
| 473 | West Pokot | 2024 | 127.336667 | 53.448750 | 54.868575 | 1.335833 |
| 474 | West Pokot | 2025 | 111.733889 | 62.616111 | 60.615422 | 1.332222 |
475 rows × 6 columns
# Step 1: Keep province info for later merge
county_province_map = df[['counties', 'provinces']].drop_duplicates()

# Step 2: Group by counties and year (correct averaging)
avg_prices_county = (
    df.groupby(['counties', 'year'], as_index=False)[
        ['beans_close', 'maize_close', 'potatoes_1kg_close', 'food_price_index_close']
    ].mean()
)

# Step 3: Merge province info back
avg_prices_county = avg_prices_county.merge(county_province_map, on='counties', how='left')

# Step 4: Append province name to county
avg_prices_county['county_label'] = avg_prices_county['counties'] + " (" + avg_prices_county['provinces'] + ")"

# Step 5: Reshape for visualization
price_columns = ['beans_close', 'maize_close', 'potatoes_1kg_close', 'food_price_index_close']
df_long = avg_prices_county.melt(
    id_vars=['provinces', 'county_label', 'year'],
    value_vars=price_columns,
    var_name='Commodity',
    value_name='Price'
)

# Step 6: Plot
sns.set_style("whitegrid")

g = sns.relplot(
    data=df_long,
    kind='line',
    x='year',
    y='Price',
    hue='Commodity',
    col='county_label',    # use new county label
    col_wrap=3,
    height=3.5,
    aspect=1.5,
    legend='full'
)

g.set_axis_labels('Year', 'Average Closing Price')
g.set_titles(col_template='{col_name}')
g.fig.suptitle('Food Price Trends by County (2007–2025)', fontsize=16, y=1.03)

plt.savefig('county_price_trends_labeled.png', bbox_inches='tight')
print("Faceted plot saved to 'county_price_trends_labeled.png'")
Faceted plot saved to 'county_price_trends_labeled.png'
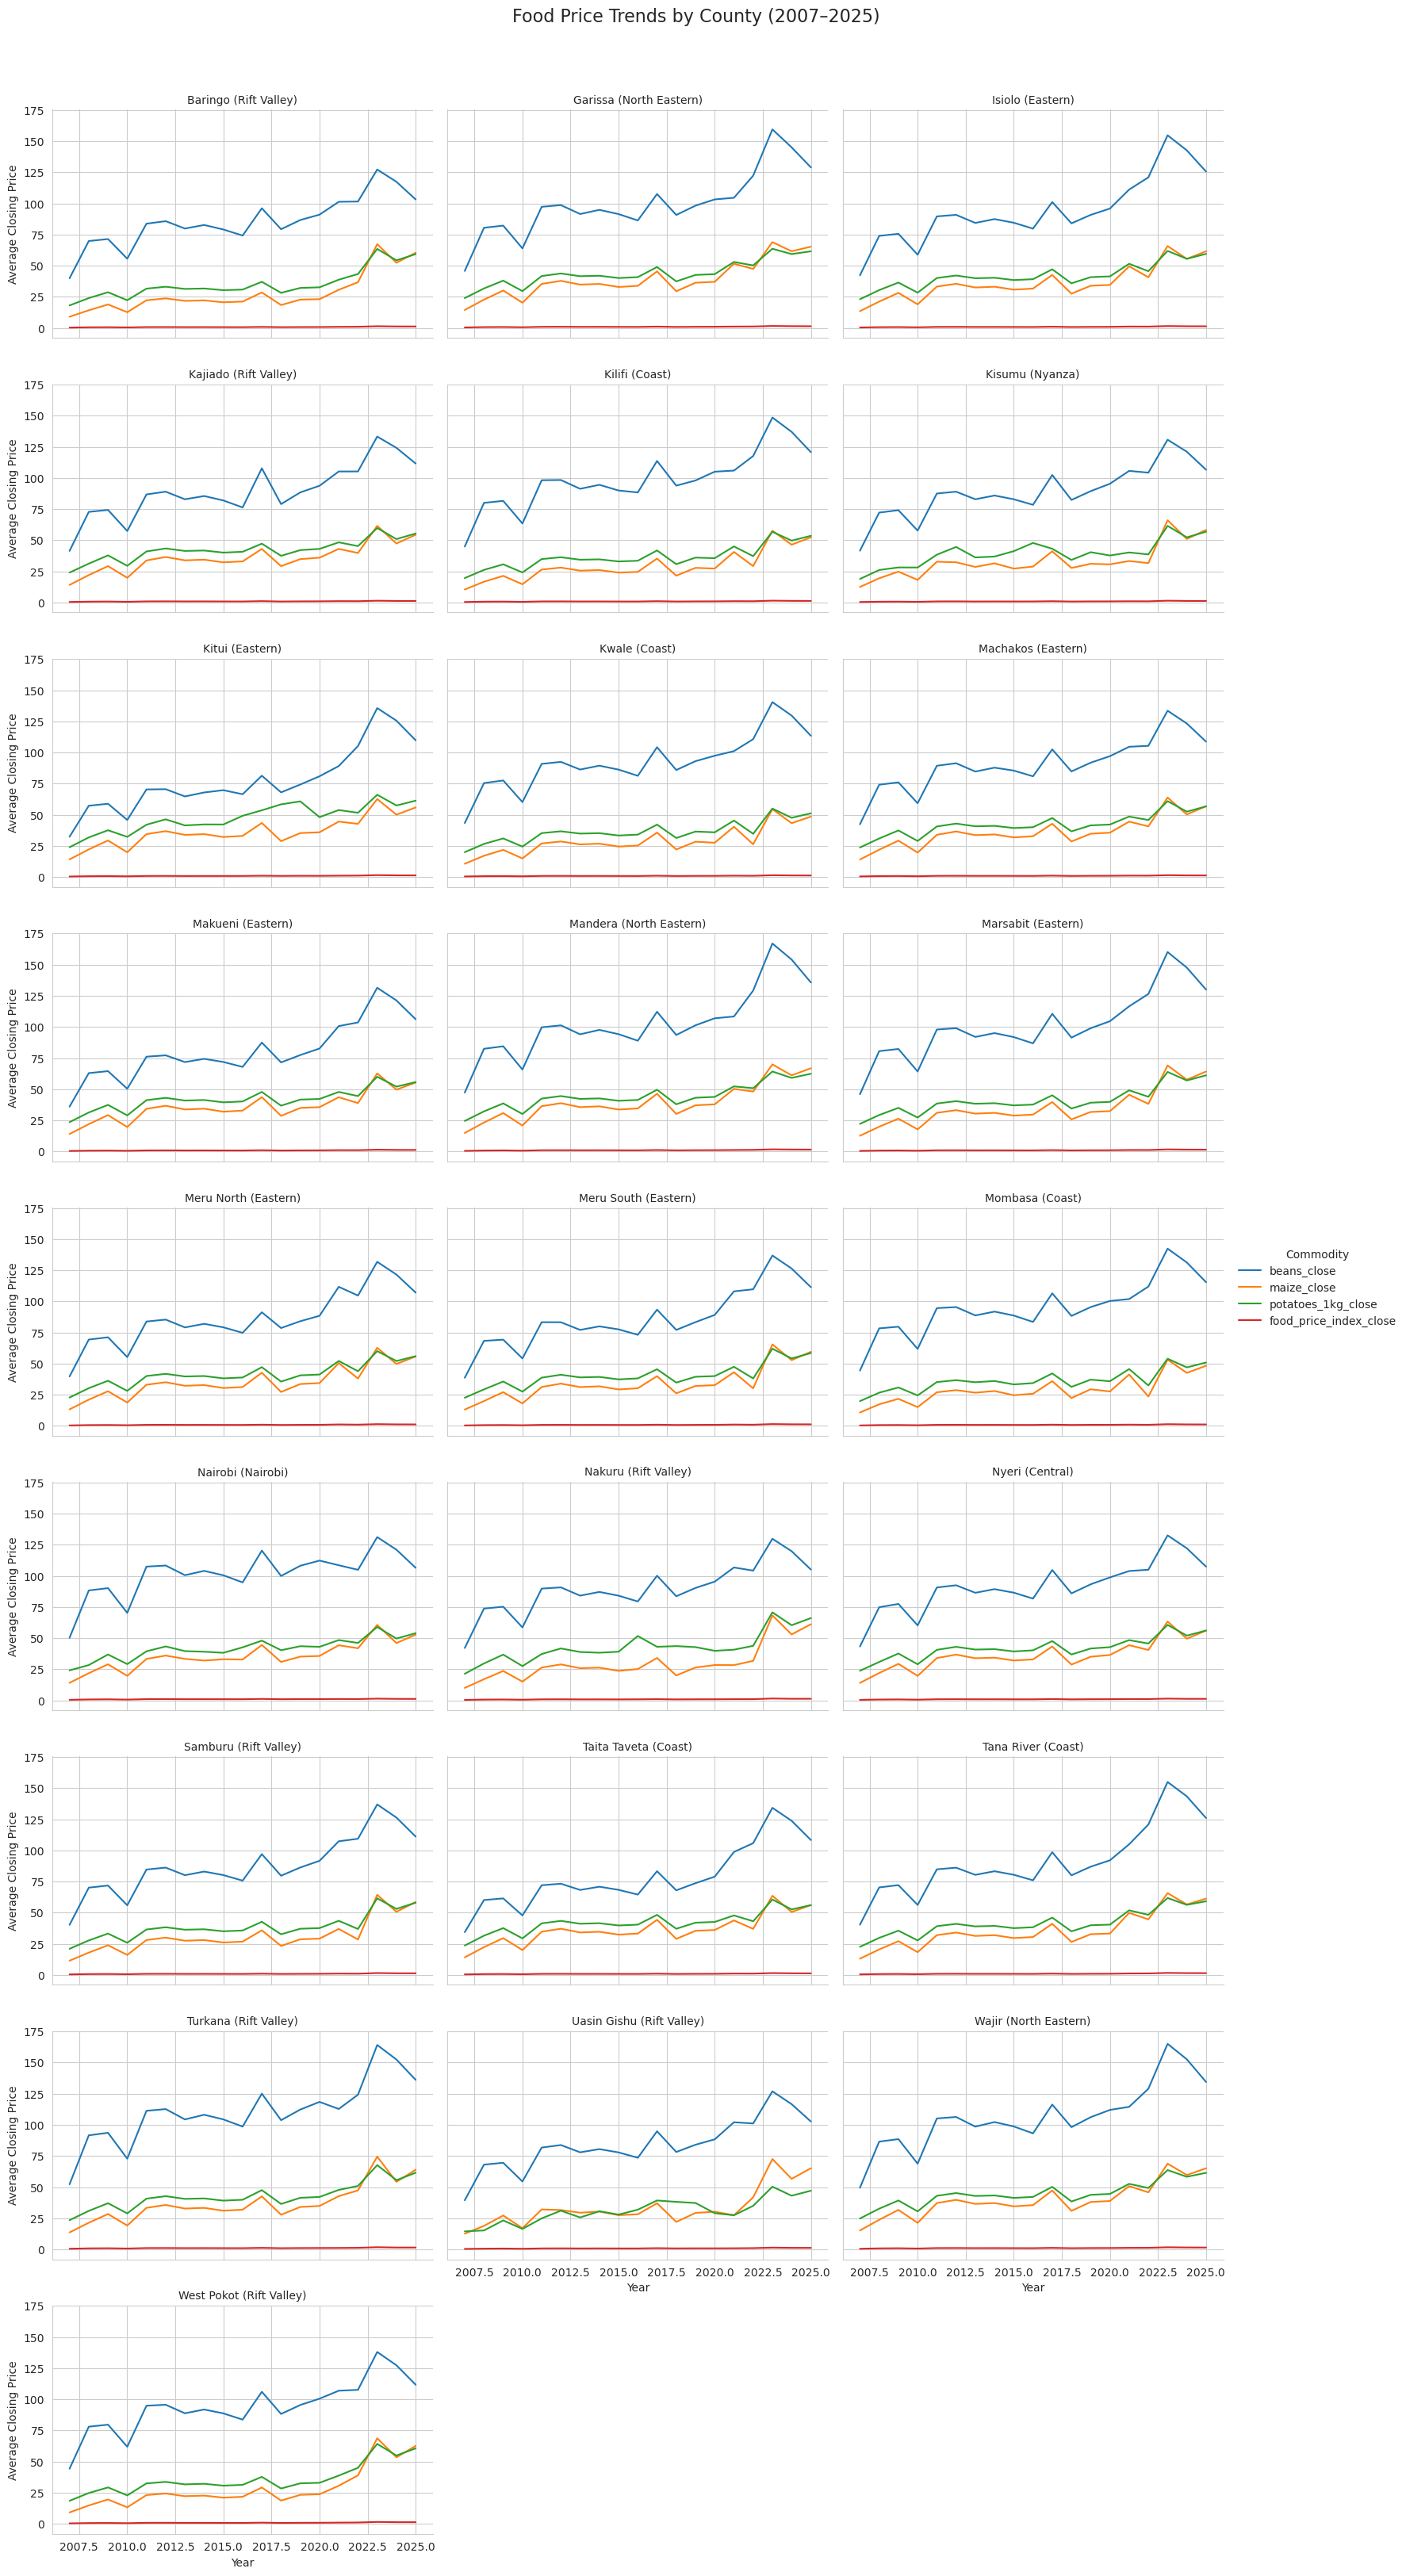 Food Price Trends by County (2007–2025)
# Created a New Column average_food_price
avg_prices_county['avg_food_price'] = avg_prices_county[
    ['beans_close', 'maize_close', 'potatoes_1kg_close']
].mean(axis=1)
avg_prices_county| counties | year | beans_close | maize_close | potatoes_1kg_close | food_price_index_close | provinces | county_label | avg_food_price | |
|---|---|---|---|---|---|---|---|---|---|
| 0 | Baringo | 2007 | 39.981759 | 9.070648 | 18.166039 | 0.381111 | Rift Valley | Baringo (Rift Valley) | 22.406149 |
| 1 | Baringo | 2008 | 69.886667 | 14.259815 | 24.055556 | 0.613148 | Rift Valley | Baringo (Rift Valley) | 36.067346 |
| 2 | Baringo | 2009 | 71.460093 | 18.932685 | 28.765706 | 0.676019 | Rift Valley | Baringo (Rift Valley) | 39.719494 |
| 3 | Baringo | 2010 | 55.676574 | 12.716296 | 22.336981 | 0.513889 | Rift Valley | Baringo (Rift Valley) | 30.243284 |
| 4 | Baringo | 2011 | 83.811296 | 22.299167 | 31.651383 | 0.780648 | Rift Valley | Baringo (Rift Valley) | 45.920615 |
| ... | ... | ... | ... | ... | ... | ... | ... | ... | ... |
| 470 | West Pokot | 2021 | 106.917500 | 30.592917 | 38.749200 | 0.999583 | Rift Valley | West Pokot (Rift Valley) | 58.753206 |
| 471 | West Pokot | 2022 | 107.625000 | 38.933750 | 45.029183 | 1.085417 | Rift Valley | West Pokot (Rift Valley) | 63.862644 |
| 472 | West Pokot | 2023 | 138.033333 | 68.738750 | 64.208533 | 1.536667 | Rift Valley | West Pokot (Rift Valley) | 90.326872 |
| 473 | West Pokot | 2024 | 127.336667 | 53.448750 | 54.868575 | 1.335833 | Rift Valley | West Pokot (Rift Valley) | 78.551331 |
| 474 | West Pokot | 2025 | 111.733889 | 62.616111 | 60.615422 | 1.332222 | Rift Valley | West Pokot (Rift Valley) | 78.321807 |
475 rows × 9 columns
# Compute the long-term average for each County
county_avg_overall = (
    avg_prices_county.groupby('counties', as_index=False)['avg_food_price']
    .mean()
    .sort_values(by='avg_food_price', ascending=False)
)

# Display results
print(county_avg_overall)

# Get the top & bottom County
top_county = county_avg_overall.iloc[0]
bottom_county = county_avg_overall.iloc[-1]
print(f"County with consistently highest food price: {top_county['counties']} ({top_county['avg_food_price']:.2f})")
print(f"County with consistently lowest food price: {bottom_county['counties']} ({bottom_county['avg_food_price']:.2f})")
        counties  avg_food_price
23         Wajir       63.705852
21       Turkana       63.455772
10       Mandera       62.450173
1        Garissa       60.877888
15       Nairobi       59.616837
11      Marsabit       59.035170
2         Isiolo       57.636550
17         Nyeri       56.529800
8       Machakos       56.230134
20    Tana River       56.217690
3        Kajiado       55.728368
4         Kilifi       54.770632
12    Meru North       54.318829
16        Nakuru       54.172254
5         Kisumu       53.851025
6          Kitui       53.719964
13    Meru South       53.655970
14       Mombasa       53.358758
24    West Pokot       52.861940
9        Makueni       52.855744
7          Kwale       52.599195
18       Samburu       52.502900
19  Taita Taveta       52.309043
0        Baringo       49.603472
22   Uasin Gishu       49.594992
County with consistently highest food price: Wajir (63.71)
County with consistently lowest food price: Uasin Gishu (49.59)# List of commodities to analyze
crops = ['beans_close', 'maize_close', 'potatoes_1kg_close', 'food_price_index_close']
for crop in crops:
crop_name = crop.replace('_close', '').capitalize()
print(f"\n🌾 Ranking of counties by average {crop_name} price:\n")
# Compute average price per county
county_avg = (
avg_prices_county.groupby('counties', as_index=False)[crop]
.mean()
.sort_values(by=crop, ascending=False)
)
# Print full ranking
for i, row in county_avg.iterrows():
print(f"{i+1}. {row['counties']}: {row[crop]:.2f}")
# Identify top and bottom county
top = county_avg.iloc[0]
bottom = county_avg.iloc[-1]
# Print summary
print(f"\n🏆 Highest average {crop_name} price: {top['counties']} ({top[crop]:.2f})")
print(f"💰 Lowest average {crop_name} price: {bottom['counties']} ({bottom[crop]:.2f})")
print("-" * 60)🌾 Ranking of counties by average Beans price:
22. Turkana: 110.47
23. Wajir: 106.61
24. Mandera: 103.39
25. Nairobi: 101.45
26. Marsabit: 101.17
27. Garissa: 99.67
28. Kilifi: 98.50
29. Mombasa: 94.78
30. Isiolo: 94.48
31. West Pokot: 94.18
32. Kwale: 92.56
33. Tana River: 91.42
34. Nyeri: 91.42
35. Machakos: 90.67
36. Nakuru: 89.50
37. Kajiado: 89.33
38. Kisumu: 88.98
39. Samburu: 88.05
40. Meru South: 86.35
41. Meru North: 86.28
42. Baringo: 85.64
43. Uasin Gishu: 84.31
44. Makueni: 80.81
45. Taita Taveta: 78.69
46. Kitui: 77.55
🏆 Highest average Beans price: Turkana (110.47)
💰 Lowest average Beans price: Kitui (77.55)
------------------------------------------------------------
🌾 Ranking of counties by average Maize price:
47. Wajir: 39.90
48. Mandera: 39.62
49. Garissa: 39.05
50. Turkana: 36.99
51. Isiolo: 36.39
52. Kitui: 36.27
53. Taita Taveta: 36.17
54. Nyeri: 36.14
55. Machakos: 36.05
56. Makueni: 35.87
57. Tana River: 35.75
58. Kajiado: 35.71
59. Nairobi: 35.65
60. Meru North: 35.32
61. Marsabit: 34.99
62. Meru South: 34.13
63. Uasin Gishu: 33.53
64. Kisumu: 33.01
65. Samburu: 31.10
66. Nakuru: 30.20
67. Kilifi: 29.28
68. Mombasa: 28.99
69. Kwale: 28.89
70. West Pokot: 28.49
71. Baringo: 27.78
🏆 Highest average Maize price: Wajir (39.90)
💰 Lowest average Maize price: Baringo (27.78)
------------------------------------------------------------
🌾 Ranking of counties by average Potatoes_1kg price:
72. Kitui: 47.34
73. Wajir: 44.61
74. Mandera: 44.34
75. Garissa: 43.91
76. Turkana: 42.91
77. Nakuru: 42.82
78. Kajiado: 42.15
79. Taita Taveta: 42.06
80. Isiolo: 42.04
81. Nyeri: 42.03
82. Machakos: 41.97
83. Makueni: 41.89
84. Nairobi: 41.74
85. Tana River: 41.49
86. Meru North: 41.35
87. Marsabit: 40.95
88. Meru South: 40.49
89. Kisumu: 39.56
90. Samburu: 38.35
91. Kilifi: 36.54
92. Kwale: 36.35
93. Mombasa: 36.30
94. West Pokot: 35.92
95. Baringo: 35.39
96. Uasin Gishu: 30.95
🏆 Highest average Potatoes_1kg price: Kitui (47.34)
💰 Lowest average Potatoes_1kg price: Uasin Gishu (30.95)
------------------------------------------------------------
🌾 Ranking of counties by average Food_price_index price:
97. Wajir: 1.08
98. Turkana: 1.08
99. Mandera: 1.06
100. Garissa: 1.04
101. Nairobi: 1.01
102. Marsabit: 1.00
103. Isiolo: 0.98
104. Nyeri: 0.96
105. Machakos: 0.96
106. Tana River: 0.96
107. Kajiado: 0.95
108. Kilifi: 0.93
109. Meru North: 0.92
110. Nakuru: 0.92
111. Kisumu: 0.92
112. Kitui: 0.91
113. Meru South: 0.91
114. Mombasa: 0.91
115. West Pokot: 0.90
116. Makueni: 0.90
117. Kwale: 0.89
118. Samburu: 0.89
119. Taita Taveta: 0.89
120. Uasin Gishu: 0.84
121. Baringo: 0.84
🏆 Highest average Food_price_index price: Wajir (1.08)
💰 Lowest average Food_price_index price: Baringo (0.84)
------------------------------------------------------------# Step 3: Group by market and year to get average closing prices per year
avg_prices_mkt = (
df.groupby(['mkt_name','year'], as_index=False)[['beans_close', 'maize_close','potatoes_1kg_close','food_price_index_close']].mean()
)
avg_prices_mkt| mkt_name | year | beans_close | maize_close | potatoes_1kg_close | food_price_index_close | |
|---|---|---|---|---|---|---|
| 0 | Alango Arba | 2007 | 46.450833 | 14.410000 | 23.835700 | 0.481667 |
| 1 | Alango Arba | 2008 | 80.490833 | 23.034167 | 32.010167 | 0.770000 |
| 2 | Alango Arba | 2009 | 82.659167 | 30.299167 | 38.218767 | 0.857500 |
| 3 | Alango Arba | 2010 | 64.414167 | 20.539167 | 29.866667 | 0.650000 |
| 4 | Alango Arba | 2011 | 97.013333 | 35.906667 | 42.129167 | 0.991667 |
| ... | ... | ... | ... | ... | ... | ... |
| 3491 | Wote town (Makueni) | 2021 | 100.047500 | 43.669167 | 48.013917 | 1.087500 |
| 3492 | Wote town (Makueni) | 2022 | 102.910000 | 39.663333 | 45.069467 | 1.063333 |
| 3493 | Wote town (Makueni) | 2023 | 131.051667 | 62.497500 | 59.910550 | 1.438333 |
| 3494 | Wote town (Makueni) | 2024 | 120.897500 | 49.476667 | 51.972333 | 1.261667 |
| 3495 | Wote town (Makueni) | 2025 | 105.516667 | 55.046667 | 55.548244 | 1.225556 |
3496 rows × 6 columns
# Step 1: Create a mapping of market → county & province
market_location_map = df[['mkt_name', 'counties', 'provinces']].drop_duplicates()

# Step 2: Group by market and year to compute averages (if not already done)
avg_prices_mkt = (
    df.groupby(['mkt_name', 'year'], as_index=False)[
        ['beans_close', 'maize_close', 'potatoes_1kg_close', 'food_price_index_close']
    ].mean()
)

# Step 3: Merge location info into the averages
avg_prices_mkt = avg_prices_mkt.merge(market_location_map, on='mkt_name', how='left')

# Step 4: Append county and province to market name
avg_prices_mkt['mkt_label'] = (
    avg_prices_mkt['mkt_name']
    + " ("
    + avg_prices_mkt['counties']
    + ", "
    + avg_prices_mkt['provinces']
    + ")"
)

# Step 5: Reshape data for plotting
price_columns = ['beans_close', 'maize_close', 'potatoes_1kg_close', 'food_price_index_close']
df_long = avg_prices_mkt.melt(
    id_vars=['mkt_label', 'year'],
    value_vars=price_columns,
    var_name='Commodity',
    value_name='Price'
)

print("--- Head of Reshaped (Long) Data ---")
print(df_long.head(), "\n")

# Step 6: Plot
sns.set_style("whitegrid")

g = sns.relplot(
    data=df_long,
    kind='line',
    x='year',
    y='Price',
    hue='Commodity',
    col='mkt_label',     # use new combined label
    col_wrap=3,
    height=3.5,
    aspect=1.5,
    legend='full'
)

g.set_axis_labels('Year', 'Average Closing Price')
g.set_titles(col_template='{col_name}')
g.fig.suptitle('Food Price Trends by Market (2007–2025)', fontsize=16, y=1.03)

plt.savefig('Market_price_trends_labeled.png', bbox_inches='tight')
print("Faceted plot saved to 'Market_price_trends_labeled.png'")
--- Head of Reshaped (Long) Data ---
                              mkt_label  year    Commodity      Price
0  Alango Arba (Garissa, North Eastern)  2007  beans_close  46.450833
1  Alango Arba (Garissa, North Eastern)  2008  beans_close  80.490833
2  Alango Arba (Garissa, North Eastern)  2009  beans_close  82.659167
3  Alango Arba (Garissa, North Eastern)  2010  beans_close  64.414167
4  Alango Arba (Garissa, North Eastern)  2011  beans_close  97.013333

Faceted plot saved to 'Market_price_trends_labeled.png'

# Created a New Column average_food_price per market
avg_prices_mkt['avg_food_price'] = avg_prices_mkt[
    ['beans_close', 'maize_close', 'potatoes_1kg_close']
].mean(axis=1)
avg_prices_mkt| mkt_name | year | beans_close | maize_close | potatoes_1kg_close | food_price_index_close | counties | provinces | mkt_label | avg_food_price | |
|---|---|---|---|---|---|---|---|---|---|---|
| 0 | Alango Arba | 2007 | 46.450833 | 14.410000 | 23.835700 | 0.481667 | Garissa | North Eastern | Alango Arba (Garissa, North Eastern) | 28.232178 |
| 1 | Alango Arba | 2008 | 80.490833 | 23.034167 | 32.010167 | 0.770000 | Garissa | North Eastern | Alango Arba (Garissa, North Eastern) | 45.178389 |
| 2 | Alango Arba | 2009 | 82.659167 | 30.299167 | 38.218767 | 0.857500 | Garissa | North Eastern | Alango Arba (Garissa, North Eastern) | 50.392367 |
| 3 | Alango Arba | 2010 | 64.414167 | 20.539167 | 29.866667 | 0.650000 | Garissa | North Eastern | Alango Arba (Garissa, North Eastern) | 38.273333 |
| 4 | Alango Arba | 2011 | 97.013333 | 35.906667 | 42.129167 | 0.991667 | Garissa | North Eastern | Alango Arba (Garissa, North Eastern) | 58.349722 |
| ... | ... | ... | ... | ... | ... | ... | ... | ... | ... | ... |
| 3491 | Wote town (Makueni) | 2021 | 100.047500 | 43.669167 | 48.013917 | 1.087500 | Makueni | Eastern | Wote town (Makueni) (Makueni, Eastern) | 63.910194 |
| 3492 | Wote town (Makueni) | 2022 | 102.910000 | 39.663333 | 45.069467 | 1.063333 | Makueni | Eastern | Wote town (Makueni) (Makueni, Eastern) | 62.547600 |
| 3493 | Wote town (Makueni) | 2023 | 131.051667 | 62.497500 | 59.910550 | 1.438333 | Makueni | Eastern | Wote town (Makueni) (Makueni, Eastern) | 84.486572 |
| 3494 | Wote town (Makueni) | 2024 | 120.897500 | 49.476667 | 51.972333 | 1.261667 | Makueni | Eastern | Wote town (Makueni) (Makueni, Eastern) | 74.115500 |
| 3495 | Wote town (Makueni) | 2025 | 105.516667 | 55.046667 | 55.548244 | 1.225556 | Makueni | Eastern | Wote town (Makueni) (Makueni, Eastern) | 72.037193 |
3496 rows × 10 columns
# Compute the long-term average for each market
mkt_avg_overall = (
    avg_prices_mkt.groupby('mkt_name', as_index=False)['avg_food_price']
    .mean()
    .sort_values(by='avg_food_price', ascending=False)
)

# Display results
print(mkt_avg_overall)

# Get the top & bottom County
top_mkt = mkt_avg_overall.iloc[0]
bottom_mkt = mkt_avg_overall.iloc[-1]
print(f"Market with consistently highest food price: {top_mkt['mkt_name']} ({top_mkt['avg_food_price']:.2f})")
print(f"Market with consistently lowest food price: {bottom_mkt['mkt_name']} ({bottom_mkt['avg_food_price']:.2f})")
                   mkt_name  avg_food_price
103             Lodwar town       66.537321
64    Kalobeyei (Village 2)       66.192429
122               Loturerei       66.142083
32             Eliye Centre       66.116122
63    Kalobeyei (Village 1)       65.780203
..                      ...             ...
119           Lororo Centre       48.564512
101            Loboi Center       48.427539
93                  Koriema       48.419481
136  Marigat town (Baringo)       48.349804
81           Kimalel Center       48.313668

[184 rows x 2 columns]
Market with consistently highest food price: Lodwar town (66.54)
Market with consistently lowest food price: Kimalel Center (48.31)# List of commodities to analyze
crops = ['beans_close', 'maize_close', 'potatoes_1kg_close', 'food_price_index_close']
for crop in crops:
crop_name = crop.replace('_close', '').capitalize()
print(f"\n🌾 Ranking of markets by average {crop_name} price:\n")
# Compute average price per Market
mkt_avg = (
avg_prices_mkt.groupby('mkt_name', as_index=False)[crop]
.mean()
.sort_values(by=crop, ascending=False)
)
# Print full ranking
for i, row in mkt_avg.iterrows():
print(f"{i+1}. {row['mkt_name']}: {row[crop]:.2f}")
# Identify top and bottom Market
top = mkt_avg.iloc[0]
bottom = mkt_avg.iloc[-1]
# Print summary
print(f"\n🏆 Highest average {crop_name} price: {top['mkt_name']} ({top[crop]:.2f})")
print(f"💰 Lowest average {crop_name} price: {bottom['mkt_name']} ({bottom[crop]:.2f})")
print("-" * 60)🌾 Ranking of markets by average Beans price:
45. HongKong (Kakuma): 115.70
46. Lodwar town: 114.98
47. Kakuma 4: 114.28
48. Ethiopia (Kakuma): 114.22
49. Lopur: 114.14
50. Mogadishu (Kakuma): 113.98
51. Kakuma 3: 113.82
52. Loturerei: 113.81
53. Eliye Centre: 113.78
54. Kalobeyei (Village 2): 113.60
55. Lorugum: 113.60
56. Namoruputh: 113.26
57. Lokiriama: 112.90
58. Kalemunyang: 112.77
59. Letea: 112.62
60. Kalokol: 112.59
61. Alemsekon: 112.44
62. Kataboi: 112.24
63. Kalobeyei (Village 1): 112.16
64. Kakuma 2: 112.15
65. Naduat: 111.91
66. Lolupe: 111.88
67. Lokangae: 111.70
68. Kaeris: 111.47
69. Lowarengak: 111.03
70. Lokitaung: 111.01
71. Kaleng: 110.89
72. Kaikor: 110.71
73. Kaakelai: 110.71
74. Napak: 110.67
75. Nakinomet: 110.64
76. Kokuro: 110.58
77. Kalobeyei (Village 3): 110.40
78. Wajir town: 110.21
79. Aposta: 110.10
80. Dagahaley (Daadab): 109.79
81. Lokapel: 109.66
82. Lokichar (Turkana): 109.38
83. Kiliwaheri: 109.27
84. Loyangalani: 109.13
85. Naakalei: 109.00
86. Lokichoggio: 108.69
87. Banissa: 108.39
88. Tarbaj: 108.30
89. Lagbogol: 108.02
90. Griftu: 107.23
91. Marigat (Baringo): 106.63
92. Kargi: 105.93
93. Hadado: 105.79
94. Bute: 105.21
95. Nakukulas: 104.80
96. Kalemgorok: 104.77
97. Kibra (Nairobi): 104.66
98. Eldas: 104.33
99. El Wak: 104.22
100. Habaswein: 103.83
101. Katilia: 103.51
102. Marsabit: 103.25
103. Dub Goba: 103.24
104. Marsabit town: 103.14
105. Elelea: 103.08
106. Kawangware (Nairobi): 102.85
107. Kangemi (Nairobi): 102.78
108. Dirib: 102.74
109. Saretho: 102.52
110. Wakulima (Nairobi): 102.47
111. Songa: 102.35
112. Nairobi: 102.31
113. Lotubae: 102.22
114. Kitengela (Kajiado): 102.22
115. Karare: 102.02
116. Mathare (Nairobi): 101.83
117. Rhamu: 101.82
118. Kargi South Horr: 101.71
119. Lokwii: 101.29
120. Baraki: 101.23
121. Morulem: 101.21
122. Alinjugur: 101.14
123. Lokori: 101.13
124. Ashabito: 100.98
125. Takaba (Mandera): 100.90
126. Alango Arba: 100.84
127. Mandera town: 100.78
128. Mandera: 100.76
129. Korr: 100.61
130. Damajale: 100.48
131. Modogashe: 100.28
132. IFO (Daadab): 100.08
133. Sericho Center: 100.06
134. Shanta Abak: 99.95
135. Saka Town: 98.97
136. Dadaab town: 98.75
137. Garissa town (Garissa): 98.68
138. Kilifi: 98.50
139. Garissa: 98.48
140. Dertu: 98.41
141. Iresaboru Centre: 98.30
142. Malka GALLA: 98.17
143. Dandora (Nairobi): 97.94
144. Maalamin: 97.87
145. Lesirkan: 97.85
146. Liboi: 97.75
147. Loglogo: 97.07
148. Jarajara: 96.76
149. Nanigi: 96.16
150. Mukuru (Nairobi): 96.03
151. Benane: 95.97
152. Kajiado: 95.64
153. Bulesa Bulesa: 95.57
154. Shauri Yako: 95.51
155. Kisumu Ndogo (Mombasa): 95.49
156. Hagadera (Daadab): 95.48
157. Biliqo: 95.41
158. Moroto (Mombasa): 95.33
159. Kongowea (Mombasa): 95.27
160. Merti CENTER: 95.22
161. Shonda (Mombasa): 95.15
162. Baragoi: 95.13
163. Kalahari (Mombasa): 95.02
164. Garbatulla: 94.93
165. Ngurunit: 94.62
166. Bilbil: 94.56
167. Malkadaka: 94.50
168. Boka: 94.46
169. Makutano (West Pokot): 94.32
170. Mombasa: 94.25
171. Lomut (West Pokot): 94.03
172. Charidende: 93.62
173. Junda (Mombasa): 93.53
174. Bangladesh (Mombasa): 93.47
175. Boji: 93.45
176. Bura: 92.96
177. Laisamis Town: 92.82
178. Vanga (Kwale): 92.56
179. Makere: 91.74
180. Karatina (Nyeri): 91.42
181. Merille Town: 91.14
182. Tala Centre Market (Machakos): 90.67
183. Hola town: 90.43
184. Nakuru: 89.80
185. Kibuye (Kisumu): 89.24
186. Wakulima (Nakuru): 89.19
187. Kisumu: 88.72
188. Garsen: 88.36
189. Wayu: 88.20
190. Tarasaa: 88.16
191. Kipini: 87.99
192. Ngilai: 87.75
193. Isiolo town: 87.75
194. Bangale: 87.62
195. Wamba: 87.32
196. Lolkuniyani: 87.00
197. Oldonyiro: 86.80
198. Kiwanja: 86.69
199. Porro: 86.56
200. Lengusaka: 86.44
201. Lpus: 86.39
202. Kaanwa (Tharaka Nithi): 86.35
203. Kipsing CENTER: 86.30
204. Lodungokwe: 86.23
205. Ngaremara: 85.87
206. Kisima: 85.37
207. Lolkunono: 85.33
208. Maralal: 85.26
209. Loosuk: 84.93
210. Chemolingot: 84.85
211. Suguta: 84.64
212. Eldoret town (Uasin Gishu): 84.31
213. Nginyang: 83.98
214. Emali: 83.75
215. Amaya: 83.43
216. Kitui: 83.33
217. Illbissil Food Market (Kajiado): 83.02
218. Koriema: 82.69
219. Lororo Centre: 82.66
220. Kimalel Center: 82.25
221. Loboi Center: 82.21
222. Marigat town (Baringo): 82.04
223. Kibwezi: 81.00
224. Wote town (Makueni): 80.23
225. Makueni: 80.20
226. Kathonzweni (Makueni): 78.88
227. Mtito Andei: 78.69
228. Kitui town (Kitui): 71.77
🏆 Highest average Beans price: HongKong (Kakuma) (115.70)
💰 Lowest average Beans price: Kitui town (Kitui) (71.77)
------------------------------------------------------------
🌾 Ranking of markets by average Maize price:
229. Hagadera (Daadab): 41.70
230. Wajir town: 40.75
231. Lagbogol: 40.48
232. Tarbaj: 40.35
233. El Wak: 40.13
234. Dagahaley (Daadab): 40.06
235. Kalobeyei (Village 1): 39.92
236. Griftu: 39.90
237. Kalobeyei (Village 2): 39.81
238. IFO (Daadab): 39.66
239. Lodwar town: 39.66
240. Loturerei: 39.65
241. Banissa: 39.63
242. Eliye Centre: 39.63
243. Habaswein: 39.62
244. Ashabito: 39.60
245. Kiliwaheri: 39.59
246. Mandera: 39.57
247. Mandera town: 39.56
248. Rhamu: 39.48
249. Damajale: 39.44
250. Dadaab town: 39.42
251. Alinjugur: 39.39
252. Hadado: 39.38
253. Bute: 39.37
254. Saretho: 39.35
255. Takaba (Mandera): 39.35
256. Eldas: 39.34
257. Baraki: 39.21
258. Garissa town (Garissa): 39.10
259. Garissa: 38.99
260. Alango Arba: 38.80
261. Modogashe: 38.80
262. Kalokol: 38.73
263. Letea: 38.55
264. Shanta Abak: 38.47
265. Nanigi: 38.46
266. Kalemunyang: 38.43
267. Lorugum: 38.37
268. Kataboi: 38.36
269. Maalamin: 38.36
270. Liboi: 38.26
271. Sericho Center: 38.15
272. Dandora (Nairobi): 38.14
273. Kalobeyei (Village 3): 38.09
274. Bilbil: 38.07
275. Bura: 37.90
276. Jarajara: 37.71
277. Namoruputh: 37.68
278. Lowarengak: 37.64
279. Saka Town: 37.59
280. Benane: 37.51
281. Dertu: 37.51
282. Garbatulla: 37.43
283. Bangale: 37.40
284. Lokitaung: 37.40
285. Iresaboru Centre: 37.31
286. Lolupe: 37.24
287. Lokiriama: 37.22
288. Kaeris: 37.21
289. Boji: 37.18
290. Mogadishu (Kakuma): 37.17
291. Naduat: 37.16
292. Naakalei: 37.14
293. Makere: 37.13
294. Malka GALLA: 37.06
295. Ethiopia (Kakuma): 37.02
296. Loyangalani: 36.93
297. Kokuro: 36.93
298. Lokichar (Turkana): 36.90
299. Kaleng: 36.89
300. Kaakelai: 36.81
301. Kangemi (Nairobi): 36.73
302. HongKong (Kakuma): 36.72
303. Lokapel: 36.71
304. Kawangware (Nairobi): 36.67
305. Kakuma 3: 36.67
306. Boka: 36.59
307. Kaikor: 36.46
308. Alemsekon: 36.43
309. Merti CENTER: 36.40
310. Nakinomet: 36.35
311. Napak: 36.35
312. Kitui town (Kitui): 36.28
313. Kitui: 36.26
314. Kakuma 2: 36.22
315. Kibra (Nairobi): 36.18
316. Mtito Andei: 36.17
317. Wayu: 36.17
318. Kathonzweni (Makueni): 36.15
319. Karatina (Nyeri): 36.14
320. Lopur: 36.13
321. Tala Centre Market (Machakos): 36.05
322. Nakukulas: 36.03
323. Kakuma 4: 36.02
324. Bulesa Bulesa: 36.00
325. Wote town (Makueni): 35.99
326. Hola town: 35.99
327. Kajiado: 35.98
328. Makueni: 35.98
329. Malkadaka: 35.96
330. Kibwezi: 35.89
331. Biliqo: 35.85
332. Kisumu: 35.78
333. Kargi: 35.76
334. Lokangae: 35.76
335. Katilia: 35.70
336. Dub Goba: 35.60
337. Dirib: 35.59
338. Kalemgorok: 35.54
339. Marsabit: 35.51
340. Elelea: 35.49
341. Ngaremara: 35.48
342. Mukuru (Nairobi): 35.46
343. Illbissil Food Market (Kajiado): 35.44
344. Marsabit town: 35.44
345. Aposta: 35.42
346. Songa: 35.38
347. Emali: 35.34
348. Kiwanja: 35.15
349. Karare: 35.14
350. Isiolo town: 35.12
351. Lotubae: 35.04
352. Morulem: 34.81
353. Lokwii: 34.80
354. Loglogo: 34.76
355. Wakulima (Nairobi): 34.74
356. Lokichoggio: 34.71
357. Lokori: 34.61
358. Mathare (Nairobi): 34.61
359. Kitengela (Kajiado): 34.25
360. Korr: 34.18
361. Kaanwa (Tharaka Nithi): 34.13
362. Kipsing CENTER: 34.10
363. Nairobi: 34.09
364. Laisamis Town: 33.80
365. Merille Town: 33.69
366. Eldoret town (Uasin Gishu): 33.53
367. Garsen: 33.24
368. Kipini: 33.13
369. Tarasaa: 33.10
370. Kargi South Horr: 33.10
371. Wamba: 33.03
372. Lengusaka: 32.92
373. Ngurunit: 32.84
374. Lolkuniyani: 32.68
375. Charidende: 32.64
376. Ngilai: 32.59
377. Oldonyiro: 32.55
378. Mombasa: 32.40
379. Nakuru: 32.22
380. Lpus: 31.68
381. Lodungokwe: 31.68
382. Lesirkan: 31.41
383. Baragoi: 31.11
384. Junda (Mombasa): 30.72
385. Kibuye (Kisumu): 30.24
386. Kisima: 30.14
387. Maralal: 29.53
388. Porro: 29.36
389. Kilifi: 29.28
390. Lolkunono: 29.27
391. Loosuk: 29.14
392. Suguta: 29.14
393. Vanga (Kwale): 28.89
394. Lomut (West Pokot): 28.79
395. Bangladesh (Mombasa): 28.50
396. Amaya: 28.46
397. Kalahari (Mombasa): 28.41
398. Shauri Yako: 28.34
399. Kisumu Ndogo (Mombasa): 28.25
400. Moroto (Mombasa): 28.25
401. Makutano (West Pokot): 28.18
402. Wakulima (Nakuru): 28.17
403. Shonda (Mombasa): 28.03
404. Kongowea (Mombasa): 28.02
405. Nginyang: 27.87
406. Chemolingot: 27.80
407. Loboi Center: 27.72
408. Lororo Centre: 27.72
409. Marigat town (Baringo): 27.71
410. Marigat (Baringo): 27.70
411. Kimalel Center: 27.56
412. Koriema: 27.51
🏆 Highest average Maize price: Hagadera (Daadab) (41.70)
💰 Lowest average Maize price: Koriema (27.51)
------------------------------------------------------------
🌾 Ranking of markets by average Potatoes_1kg price:
413. Kitui: 52.50
414. Nakuru: 49.91
415. Hagadera (Daadab): 45.97
416. Kalobeyei (Village 1): 45.27
417. Wajir town: 45.27
418. Kalobeyei (Village 2): 45.16
419. Lagbogol: 45.02
420. Lodwar town: 44.98
421. Loturerei: 44.96
422. Eliye Centre: 44.94
423. Tarbaj: 44.94
424. El Wak: 44.77
425. Griftu: 44.64
426. Dagahaley (Daadab): 44.46
427. Habaswein: 44.40
428. Banissa: 44.33
429. Ashabito: 44.33
430. Mandera: 44.31
431. Mandera town: 44.31
432. Kiliwaheri: 44.31
433. Kalokol: 44.26
434. Rhamu: 44.24
435. Hadado: 44.22
436. IFO (Daadab): 44.21
437. Eldas: 44.19
438. Bute: 44.18
439. Alinjugur: 44.17
440. Damajale: 44.17
441. Dadaab town: 44.15
442. Saretho: 44.15
443. Takaba (Mandera): 44.15
444. Letea: 44.13
445. Kalemunyang: 44.07
446. Baraki: 44.03
447. Lorugum: 44.00
448. Kataboi: 43.97
449. Kalobeyei (Village 3): 43.85
450. Garissa town (Garissa): 43.84
451. Alango Arba: 43.79
452. Garissa: 43.78
453. Modogashe: 43.70
454. Shanta Abak: 43.63
455. Dandora (Nairobi): 43.53
456. Liboi: 43.50
457. Namoruputh: 43.48
458. Maalamin: 43.48
459. Nanigi: 43.40
460. Lowarengak: 43.38
461. Sericho Center: 43.31
462. Bilbil: 43.20
463. Lokitaung: 43.20
464. Lolupe: 43.12
465. Lokiriama: 43.11
466. Naduat: 43.07
467. Kaeris: 43.06
468. Bura: 43.04
469. Jarajara: 42.95
470. Naakalei: 42.94
471. Saka Town: 42.91
472. Mogadishu (Kakuma): 42.89
473. Dertu: 42.86
474. Kokuro: 42.84
475. Lokichar (Turkana): 42.84
476. Benane: 42.84
477. Kaleng: 42.83
478. Ethiopia (Kakuma): 42.78
479. Bangale: 42.76
480. Kaakelai: 42.76
481. Garbatulla: 42.75
482. Iresaboru Centre: 42.73
483. Lokapel: 42.71
484. Loyangalani: 42.60
485. HongKong (Kakuma): 42.57
486. Boji: 42.56
487. Malka GALLA: 42.54
488. Kakuma 3: 42.54
489. Kaikor: 42.48
490. Alemsekon: 42.47
491. Makere: 42.45
492. Kangemi (Nairobi): 42.44
493. Kawangware (Nairobi): 42.42
494. Napak: 42.40
495. Nakinomet: 42.40
496. Kakuma 2: 42.28
497. Kajiado: 42.24
498. Nakukulas: 42.21
499. Lopur: 42.21
500. Boka: 42.19
501. Kitui town (Kitui): 42.19
502. Kakuma 4: 42.15
503. Kathonzweni (Makueni): 42.09
504. Mtito Andei: 42.06
505. Merti CENTER: 42.06
506. Illbissil Food Market (Kajiado): 42.05
507. Kisumu: 42.04
508. Karatina (Nyeri): 42.03
509. Wote town (Makueni): 42.01
510. Makueni: 42.00
511. Kibra (Nairobi): 42.00
512. Lokangae: 41.98
513. Tala Centre Market (Machakos): 41.97
514. Katilia: 41.91
515. Aposta: 41.87
516. Kalemgorok: 41.85
517. Kibwezi: 41.83
518. Bulesa Bulesa: 41.76
519. Malkadaka: 41.74
520. Elelea: 41.74
521. Wayu: 41.69
522. Biliqo: 41.65
523. Hola town: 41.58
524. Kargi: 41.57
525. Emali: 41.49
526. Ngaremara: 41.48
527. Mukuru (Nairobi): 41.40
528. Lotubae: 41.38
529. Lokichoggio: 41.37
530. Dub Goba: 41.35
531. Dirib: 41.34
532. Nairobi: 41.32
533. Marsabit: 41.32
534. Marsabit town: 41.26
535. Kiwanja: 41.22
536. Morulem: 41.20
537. Lokwii: 41.20
538. Songa: 41.14
539. Isiolo town: 41.14
540. Lokori: 41.08
541. Karare: 41.00
542. Wakulima (Nairobi): 40.99
543. Mathare (Nairobi): 40.91
544. Loglogo: 40.72
545. Kitengela (Kajiado): 40.69
546. Kipsing CENTER: 40.50
547. Kaanwa (Tharaka Nithi): 40.49
548. Korr: 40.35
549. Laisamis Town: 40.04
550. Merille Town: 40.01
551. Wamba: 39.92
552. Lengusaka: 39.86
553. Lolkuniyani: 39.66
554. Kargi South Horr: 39.66
555. Garsen: 39.65
556. Ngurunit: 39.58
557. Ngilai: 39.58
558. Kipini: 39.55
559. Tarasaa: 39.55
560. Oldonyiro: 39.34
561. Charidende: 39.27
562. Lodungokwe: 38.92
563. Lpus: 38.91
564. Lesirkan: 38.51
565. Baragoi: 38.32
566. Mombasa: 38.02
567. Junda (Mombasa): 37.80
568. Kisima: 37.69
569. Kibuye (Kisumu): 37.09
570. Maralal: 37.06
571. Porro: 36.91
572. Lolkunono: 36.83
573. Suguta: 36.82
574. Loosuk: 36.73
575. Kilifi: 36.54
576. Vanga (Kwale): 36.35
577. Lomut (West Pokot): 36.25
578. Amaya: 36.14
579. Bangladesh (Mombasa): 36.02
580. Kalahari (Mombasa): 35.95
581. Shauri Yako: 35.93
582. Kisumu Ndogo (Mombasa): 35.86
583. Moroto (Mombasa): 35.84
584. Wakulima (Nakuru): 35.74
585. Kongowea (Mombasa): 35.66
586. Shonda (Mombasa): 35.65
587. Makutano (West Pokot): 35.60
588. Nginyang: 35.48
589. Chemolingot: 35.41
590. Loboi Center: 35.35
591. Marigat (Baringo): 35.33
592. Lororo Centre: 35.32
593. Marigat town (Baringo): 35.30
594. Kimalel Center: 35.13
595. Koriema: 35.06
596. Eldoret town (Uasin Gishu): 30.95
🏆 Highest average Potatoes_1kg price: Kitui (52.50)
💰 Lowest average Potatoes_1kg price: Eldoret town (Uasin Gishu) (30.95)
------------------------------------------------------------
🌾 Ranking of markets by average Food_price_index price:
597. Lodwar town: 1.13
598. Kalobeyei (Village 2): 1.13
599. Loturerei: 1.13
600. Eliye Centre: 1.12
601. Kalobeyei (Village 1): 1.12
602. Wajir town: 1.11
603. Lorugum: 1.11
604. Kalokol: 1.11
605. Kalemunyang: 1.11
606. Letea: 1.11
607. HongKong (Kakuma): 1.11
608. Kataboi: 1.10
609. Namoruputh: 1.10
610. Dagahaley (Daadab): 1.10
611. Mogadishu (Kakuma): 1.10
612. Ethiopia (Kakuma): 1.10
613. Tarbaj: 1.10
614. Lagbogol: 1.10
615. Lokiriama: 1.10
616. Kiliwaheri: 1.10
617. Kakuma 3: 1.09
618. Lopur: 1.09
619. Kakuma 4: 1.09
620. Banissa: 1.09
621. Kalobeyei (Village 3): 1.09
622. Lolupe: 1.09
623. Naduat: 1.09
624. Lowarengak: 1.09
625. Kaeris: 1.09
626. Griftu: 1.09
627. Lokitaung: 1.09
628. Alemsekon: 1.08
629. Kakuma 2: 1.08
630. Kaleng: 1.08
631. Kokuro: 1.08
632. Kaakelai: 1.08
633. Kaikor: 1.08
634. Lokangae: 1.07
635. Napak: 1.07
636. Hadado: 1.07
637. Nakinomet: 1.07
638. Lokichar (Turkana): 1.07
639. Lokapel: 1.07
640. El Wak: 1.07
641. Naakalei: 1.07
642. Bute: 1.07
643. Loyangalani: 1.07
644. Eldas: 1.07
645. Habaswein: 1.06
646. Aposta: 1.06
647. Saretho: 1.05
648. Rhamu: 1.05
649. Ashabito: 1.05
650. Lokichoggio: 1.05
651. Alinjugur: 1.05
652. Mandera town: 1.05
653. Mandera: 1.05
654. Baraki: 1.05
655. Takaba (Mandera): 1.05
656. Damajale: 1.04
657. IFO (Daadab): 1.04
658. Alango Arba: 1.04
659. Kargi: 1.04
660. Hagadera (Daadab): 1.04
661. Nakukulas: 1.04
662. Kibra (Nairobi): 1.04
663. Modogashe: 1.04
664. Dadaab town: 1.03
665. Kalemgorok: 1.03
666. Shanta Abak: 1.03
667. Kangemi (Nairobi): 1.03
668. Kawangware (Nairobi): 1.03
669. Garissa town (Garissa): 1.03
670. Sericho Center: 1.03
671. Garissa: 1.03
672. Katilia: 1.03
673. Elelea: 1.02
674. Dub Goba: 1.02
675. Marsabit: 1.02
676. Marsabit town: 1.02
677. Dirib: 1.02
678. Maalamin: 1.02
679. Dandora (Nairobi): 1.02
680. Liboi: 1.02
681. Saka Town: 1.02
682. Songa: 1.01
683. Dertu: 1.01
684. Lotubae: 1.01
685. Iresaboru Centre: 1.01
686. Wakulima (Nairobi): 1.01
687. Karare: 1.01
688. Nanigi: 1.01
689. Malka GALLA: 1.01
690. Nairobi: 1.01
691. Jarajara: 1.01
692. Mathare (Nairobi): 1.01
693. Lokwii: 1.01
694. Morulem: 1.00
695. Kitengela (Kajiado): 1.00
696. Lokori: 1.00
697. Benane: 1.00
698. Bilbil: 1.00
699. Korr: 0.99
700. Garbatulla: 0.99
701. Kargi South Horr: 0.99
702. Bura: 0.99
703. Kajiado: 0.99
704. Merti CENTER: 0.98
705. Bulesa Bulesa: 0.98
706. Boka: 0.98
707. Boji: 0.98
708. Biliqo: 0.98
709. Mukuru (Nairobi): 0.98
710. Loglogo: 0.98
711. Malkadaka: 0.98
712. Kitui: 0.98
713. Nakuru: 0.97
714. Makere: 0.97
715. Marigat (Baringo): 0.96
716. Karatina (Nyeri): 0.96
717. Tala Centre Market (Machakos): 0.96
718. Hola town: 0.95
719. Bangale: 0.95
720. Lesirkan: 0.95
721. Ngurunit: 0.95
722. Laisamis Town: 0.94
723. Kisumu: 0.94
724. Wayu: 0.94
725. Charidende: 0.94
726. Merille Town: 0.93
727. Mombasa: 0.93
728. Baragoi: 0.93
729. Kilifi: 0.93
730. Isiolo town: 0.93
731. Kiwanja: 0.92
732. Ngaremara: 0.92
733. Junda (Mombasa): 0.92
734. Garsen: 0.91
735. Kaanwa (Tharaka Nithi): 0.91
736. Kipsing CENTER: 0.91
737. Tarasaa: 0.91
738. Kipini: 0.91
739. Emali: 0.91
740. Illbissil Food Market (Kajiado): 0.91
741. Wamba: 0.91
742. Ngilai: 0.91
743. Shauri Yako: 0.91
744. Kisumu Ndogo (Mombasa): 0.90
745. Moroto (Mombasa): 0.90
746. Lolkuniyani: 0.90
747. Kalahari (Mombasa): 0.90
748. Lengusaka: 0.90
749. Lomut (West Pokot): 0.90
750. Kongowea (Mombasa): 0.90
751. Shonda (Mombasa): 0.90
752. Oldonyiro: 0.90
753. Kibwezi: 0.90
754. Wote town (Makueni): 0.90
755. Makueni: 0.90
756. Makutano (West Pokot): 0.90
757. Bangladesh (Mombasa): 0.90
758. Vanga (Kwale): 0.89
759. Kathonzweni (Makueni): 0.89
760. Lpus: 0.89
761. Mtito Andei: 0.89
762. Lodungokwe: 0.89
763. Kibuye (Kisumu): 0.89
764. Kisima: 0.87
765. Wakulima (Nakuru): 0.87
766. Porro: 0.87
767. Maralal: 0.86
768. Lolkunono: 0.86
769. Loosuk: 0.86
770. Suguta: 0.85
771. Kitui town (Kitui): 0.85
772. Eldoret town (Uasin Gishu): 0.84
773. Chemolingot: 0.84
774. Amaya: 0.84
775. Nginyang: 0.84
776. Lororo Centre: 0.83
777. Loboi Center: 0.82
778. Koriema: 0.82
779. Marigat town (Baringo): 0.82
780. Kimalel Center: 0.82
🏆 Highest average Food_price_index price: Lodwar town (1.13)
💰 Lowest average Food_price_index price: Kimalel Center (0.82)
------------------------------------------------------------The most striking feature across every single province and county is a dramatic and sharp increase in food prices starting around 2022 and peaking in 2023.
Nationwide Event: The fact that this spike occurs simultaneously in all regions (from Wajir in the North Eastern to Mombasa on the Coast, and Nakuru in the Rift Valley) strongly suggests a nationwide event, such as a severe drought, major economic factors (e.g., inflation, fuel prices), or global supply chain issues affecting the entire country.
Gradual Rise Pre-2020: Before this spike, the general trend from 2007 to 2020 was a slow, gradual increase in prices for all commodities.
Post-Peak Leveling: The data from 2023 towards 2025 indicates that prices have begun to fall slightly or level off from their extreme 2023 peaks, though they remain significantly higher than pre-2022 levels.
The commodities exist in distinct price brackets:
Beans (beans_close): This is consistently the most expensive commodity by a significant margin in all regions. It also exhibits the highest volatility, with the most dramatic peaks and troughs, and it experienced the most extreme price surge during the 2022-2023 event.
Maize (maize_close) and Potatoes (potatoes_1kg_close): These two commodities are much cheaper than beans. Their prices track each other very closely across the entire 18-year period and in all regions. This high correlation suggests their prices are driven by similar market forces, and they may act as substitutes for one another.
Food Price Index (food_price_index_close): This red line remains consistently flat and low (around a value of 10-15) in every chart. This indicates it is not a direct price but likely a composite index measured against a base year, and it is not as volatile as the prices of these individual staple foods.
While all regions follow the same pattern, the magnitude of the price spikes varies.
Highest Price Spikes: The provincial chart shows that the North Eastern, Coast, and Eastern provinces experienced the most severe price peaks for beans (beans_close), with average prices surging well above 150.
Supporting County Data: This is confirmed by the county-level charts. For example, Wajir (North Eastern) and Mombasa (Coast) show some of the most extreme peaks in bean prices.
Major Production Areas: Regions like the Rift Valley (e.g., Nakuru, Uasin Gishu counties) also saw severe price hikes, but the peak for beans appears to be slightly less extreme than in the North Eastern or Coast regions. This could imply that regions further from production centers or with logistical challenges (like North Eastern) face greater price volatility.
So for this phase, we will check out the inflation across the years for each food price, by province that is, which province has the most volatile inflation prices, then we’ll double up on county and market. For the visuals, maybe a bar graph
yearly_trends = df.groupby('year')[['inflation_beans','inflation_maize','inflation_potatoes','inflation_food_price_index']].mean().reset_index()
yearly_trends| year | inflation_beans | inflation_maize | inflation_potatoes | inflation_food_price_index | |
|---|---|---|---|---|---|
| 0 | 2007 | NaN | NaN | NaN | NaN |
| 1 | 2008 | 76.315765 | 56.879592 | 31.417835 | 60.150919 |
| 2 | 2009 | 4.893913 | 38.042763 | 22.311381 | 13.429416 |
| 3 | 2010 | -20.739026 | -32.248533 | -21.447378 | -23.429946 |
| 4 | 2011 | 55.745082 | 88.456653 | 45.533238 | 56.202926 |
| 5 | 2012 | 2.391413 | 13.948148 | 8.158818 | 5.209343 |
| 6 | 2013 | -7.148972 | -7.718302 | -5.306952 | -6.883433 |
| 7 | 2014 | 3.977138 | 2.088442 | 1.213080 | 2.859937 |
| 8 | 2015 | -3.212351 | -5.952237 | -3.756499 | -3.962360 |
| 9 | 2016 | -5.412269 | 3.614774 | 3.648777 | -1.687437 |
| 10 | 2017 | 27.401214 | 35.553564 | 19.406440 | 26.811993 |
| 11 | 2018 | -16.570856 | -34.257749 | -21.988492 | -21.763514 |
| 12 | 2019 | 9.599112 | 28.776504 | 15.532052 | 13.917396 |
| 13 | 2020 | 6.045516 | 5.008895 | 2.137391 | 4.585688 |
| 14 | 2021 | 6.002355 | 32.994040 | 18.794257 | 13.657659 |
| 15 | 2022 | 8.968587 | -3.970670 | -3.384239 | 2.491997 |
| 16 | 2023 | 28.296830 | 74.229307 | 40.466001 | 38.552120 |
| 17 | 2024 | -5.188342 | -19.182532 | -12.665095 | -10.718066 |
| 18 | 2025 | -14.730568 | 14.373213 | 8.478653 | -3.544559 |
# Filter out 2007 and enhance the visualization
sns.set_theme(style='whitegrid')
plt.figure(figsize=(12, 6))
# Filter data to remove 2007 and get non-NaN values
filtered_data = yearly_trends[
(yearly_trends['year'] > 2007) &
(yearly_trends['inflation_beans'].notna())
]
# Create the bar plot
bars = sns.barplot(
data=filtered_data,
x='year',
y='inflation_beans',
color='#3498db', # Blue for positive values
edgecolor='#2980b9' # Darker blue for edges
)
# Color negative bars in red
for i, bar in enumerate(bars.patches):
if bar.get_height() < 0:
bar.set_color('#e74c3c') # Red for negative values
bar.set_edgecolor('#c0392b') # Darker red for edges
# Enhance the visual style
plt.title('Beans Inflation in Kenya (2008–2025)',
fontsize=16,
pad=20,
weight='bold')
plt.xlabel('Year', fontsize=12)
plt.ylabel('Inflation', fontsize=12)
# Customize grid
plt.grid(True, linestyle='--', alpha=0.3, axis='y')
# Rotate x-axis labels for better readability
plt.xticks(rotation=45)
# Add value labels on top/bottom of each bar
for i, row in enumerate(filtered_data.itertuples()):
if pd.notna(row.inflation_beans):
value = row.inflation_beans
va = 'bottom' if value >= 0 else 'top' # Adjust label position based on value
plt.text(i, value,
f'{value:.1f}',
ha='center',
va=va,
fontsize=10)
# Adjust layout
plt.tight_layout()
# Set y-axis limits with padding for both positive and negative values
valid_values = filtered_data['inflation_beans'].dropna()
if not valid_values.empty:
max_val = max(valid_values)
min_val = min(valid_values)
plt.ylim(min_val * 1.1, max_val * 1.1) # Add 10% padding on both ends
# Add horizontal line at y=0
plt.axhline(y=0, color='black', linestyle='-', linewidth=0.5, alpha=0.3)
plt.show()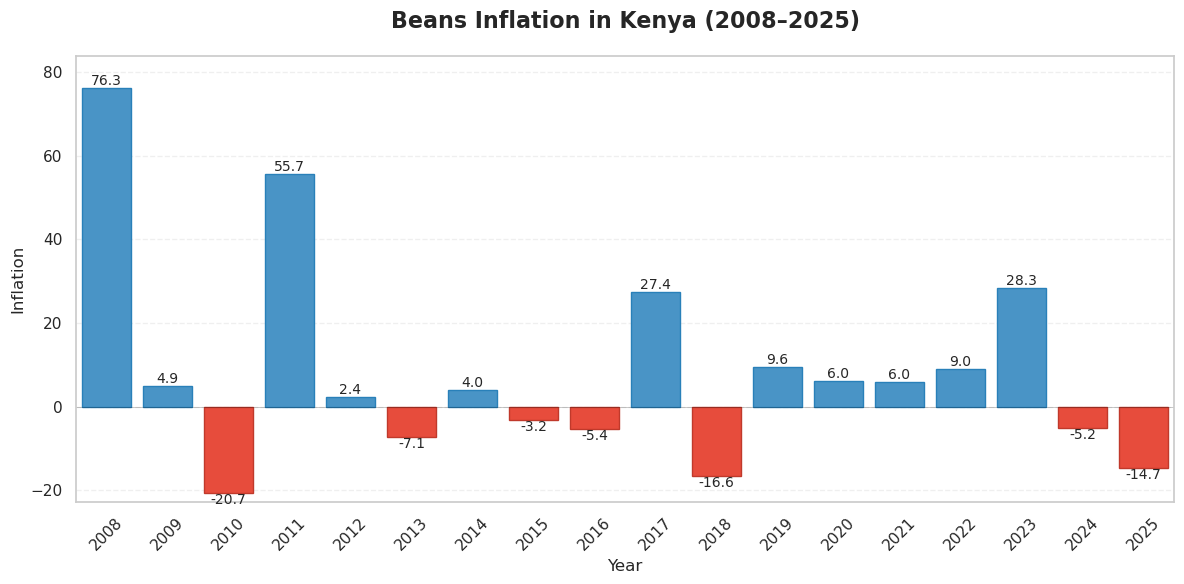 Beans Inflation in Kenya (2008–2025)
# Filter out 2007 and enhance the visualization
sns.set_theme(style='whitegrid')
plt.figure(figsize=(12, 6))
# Filter data to remove 2007 and get non-NaN values
filtered_data = yearly_trends[
(yearly_trends['year'] > 2007) &
(yearly_trends['inflation_maize'].notna())
]
# Create the bar plot
bars = sns.barplot(
data=filtered_data,
x='year',
y='inflation_maize',
color='#3498db', # Blue for positive values
edgecolor='#2980b9' # Darker blue for edges
)
# Color negative bars in red
for i, bar in enumerate(bars.patches):
if bar.get_height() < 0:
bar.set_color('#e74c3c') # Red for negative values
bar.set_edgecolor('#c0392b') # Darker red for edges
# Enhance the visual style
plt.title('Maize Inflation in Kenya (2008–2025)',
fontsize=16,
pad=20,
weight='bold')
plt.xlabel('Year', fontsize=12)
plt.ylabel('Inflation', fontsize=12)
# Customize grid
plt.grid(True, linestyle='--', alpha=0.3, axis='y')
# Rotate x-axis labels for better readability
plt.xticks(rotation=45)
# Add value labels on top/bottom of each bar
for i, row in enumerate(filtered_data.itertuples()):
if pd.notna(row.inflation_maize):
value = row.inflation_maize
va = 'bottom' if value >= 0 else 'top' # Adjust label position based on value
plt.text(i, value,
f'{value:.1f}',
ha='center',
va=va,
fontsize=10)
# Adjust layout
plt.tight_layout()
# Set y-axis limits with padding for both positive and negative values
valid_values = filtered_data['inflation_maize'].dropna()
if not valid_values.empty:
max_val = max(valid_values)
min_val = min(valid_values)
plt.ylim(min_val * 1.1, max_val * 1.1) # Add 10% padding on both ends
# Add horizontal line at y=0
plt.axhline(y=0, color='black', linestyle='-', linewidth=0.5, alpha=0.3)
plt.show()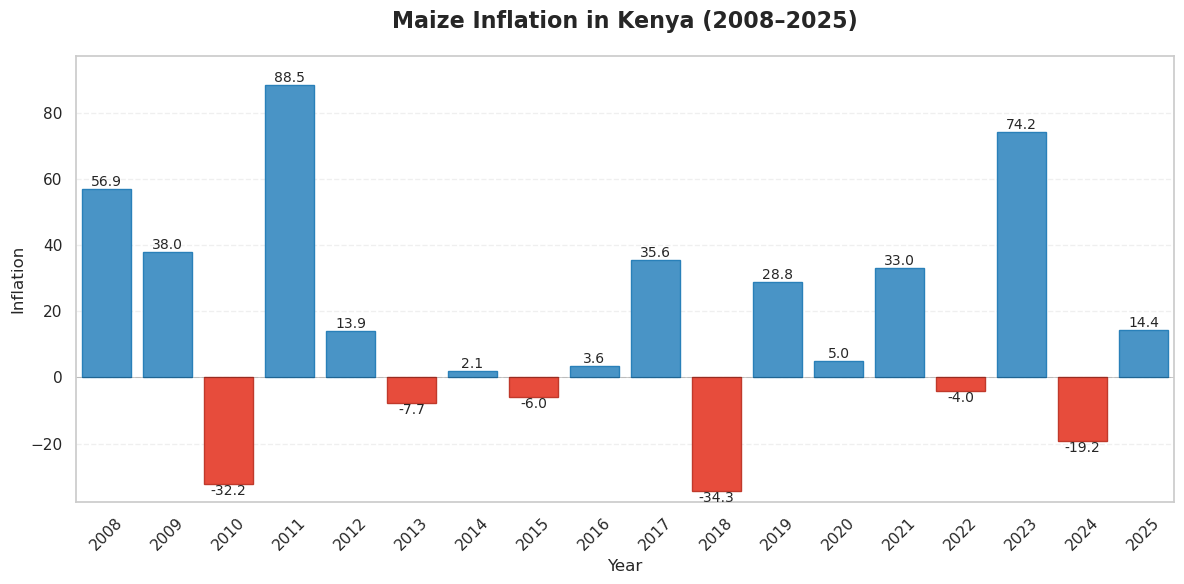 Maize Inflation in Kenya (2008–2025)
# Filter out 2007 and enhance the visualization
sns.set_theme(style='whitegrid')
plt.figure(figsize=(12, 6))
# Filter data to remove 2007 and get non-NaN values
filtered_data = yearly_trends[
(yearly_trends['year'] > 2007) &
(yearly_trends['inflation_potatoes'].notna())
]
# Create the bar plot
bars = sns.barplot(
data=filtered_data,
x='year',
y='inflation_potatoes',
color='#3498db', # Blue for positive values
edgecolor='#2980b9' # Darker blue for edges
)
# Color negative bars in red
for i, bar in enumerate(bars.patches):
if bar.get_height() < 0:
bar.set_color('#e74c3c') # Red for negative values
bar.set_edgecolor('#c0392b') # Darker red for edges
# Enhance the visual style
plt.title('Potatoes Inflation in Kenya (2008–2025)',
fontsize=16,
pad=20,
weight='bold')
plt.xlabel('Year', fontsize=12)
plt.ylabel('Inflation', fontsize=12)
# Customize grid
plt.grid(True, linestyle='--', alpha=0.3, axis='y')
# Rotate x-axis labels for better readability
plt.xticks(rotation=45)
# Add value labels on top/bottom of each bar
for i, row in enumerate(filtered_data.itertuples()):
if pd.notna(row.inflation_potatoes):
value = row.inflation_potatoes
va = 'bottom' if value >= 0 else 'top' # Adjust label position based on value
plt.text(i, value,
f'{value:.1f}',
ha='center',
va=va,
fontsize=10)
# Adjust layout
plt.tight_layout()
# Set y-axis limits with padding for both positive and negative values
valid_values = filtered_data['inflation_potatoes'].dropna()
if not valid_values.empty:
max_val = max(valid_values)
min_val = min(valid_values)
plt.ylim(min_val * 1.1, max_val * 1.1) # Add 10% padding on both ends
# Add horizontal line at y=0
plt.axhline(y=0, color='black', linestyle='-', linewidth=0.5, alpha=0.3)
plt.show()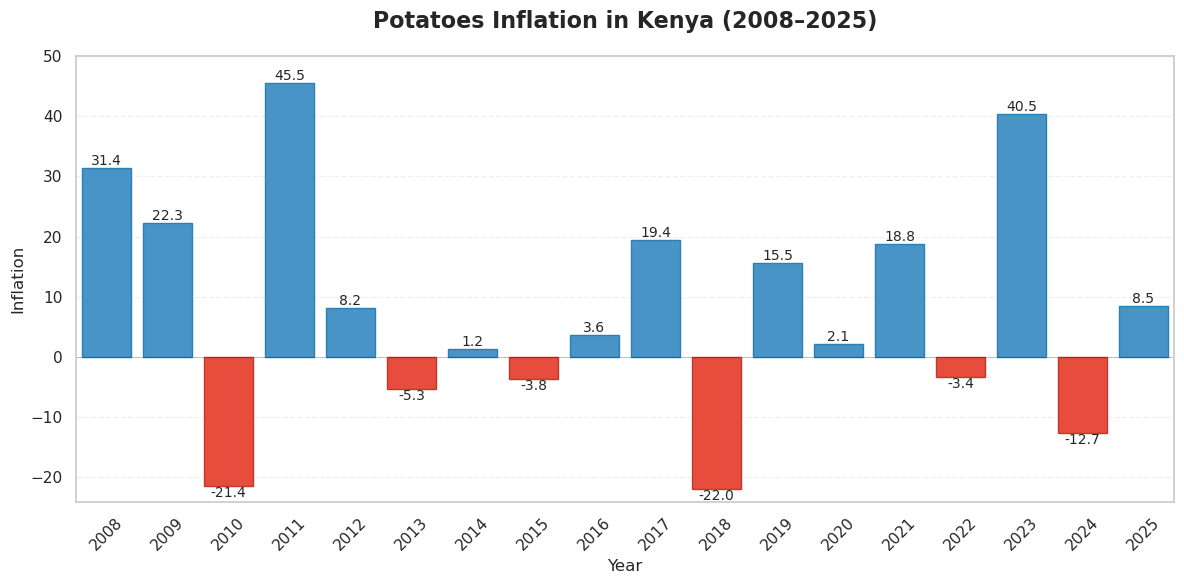 Potatoes Inflation in Kenya (2008–2025)
# Filter out 2007 and enhance the visualization
sns.set_theme(style='whitegrid')
plt.figure(figsize=(12, 6))
# Filter data to remove 2007 and get non-NaN values
filtered_data = yearly_trends[
(yearly_trends['year'] > 2007) &
(yearly_trends['inflation_food_price_index'].notna())
]
# Create the bar plot
bars = sns.barplot(
data=filtered_data,
x='year',
y='inflation_food_price_index',
color='#3498db', # Blue for positive values
edgecolor='#2980b9' # Darker blue for edges
)
# Color negative bars in red
for i, bar in enumerate(bars.patches):
if bar.get_height() < 0:
bar.set_color('#e74c3c') # Red for negative values
bar.set_edgecolor('#c0392b') # Darker red for edges
# Enhance the visual style
plt.title('Food Price Inflation in Kenya (2008–2025)',
fontsize=16,
pad=20,
weight='bold')
plt.xlabel('Year', fontsize=12)
plt.ylabel('Inflation', fontsize=12)
# Customize grid
plt.grid(True, linestyle='--', alpha=0.3, axis='y')
# Rotate x-axis labels for better readability
plt.xticks(rotation=45)
# Add value labels on top/bottom of each bar
for i, row in enumerate(filtered_data.itertuples()):
if pd.notna(row.inflation_food_price_index):
value = row.inflation_food_price_index
va = 'bottom' if value >= 0 else 'top' # Adjust label position based on value
plt.text(i, value,
f'{value:.1f}',
ha='center',
va=va,
fontsize=10)
# Adjust layout
plt.tight_layout()
# Set y-axis limits with padding for both positive and negative values
valid_values = filtered_data['inflation_food_price_index'].dropna()
if not valid_values.empty:
max_val = max(valid_values)
min_val = min(valid_values)
plt.ylim(min_val * 1.1, max_val * 1.1) # Add 10% padding on both ends
# Add horizontal line at y=0
plt.axhline(y=0, color='black', linestyle='-', linewidth=0.5, alpha=0.3)
plt.show()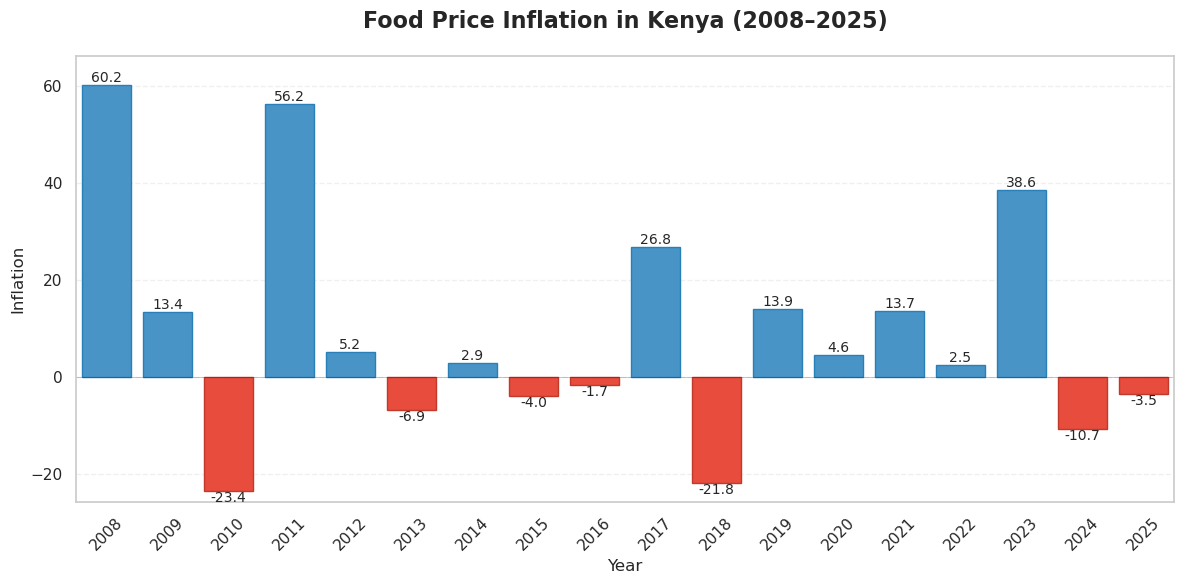 Food Price Inflation in Kenya (2008–2025)
plt.figure(figsize=(12, 6))
sns.lineplot(data=yearly_trends, x='year', y='inflation_beans', label='Beans')
sns.lineplot(data=yearly_trends, x='year', y='inflation_maize', label='Maize')
sns.lineplot(data=yearly_trends, x='year', y='inflation_potatoes', label='Potatoes')
sns.lineplot(data=yearly_trends, x='year', y='inflation_food_price_index', label='Food_Price_Index')
plt.title('Overall Inflation of Food Price Trends in Kenya (2007–2025)', fontsize=14)
plt.xlabel('Year')
plt.ylabel('Inflation')
plt.legend(title='Commodity')
plt.grid(True, linestyle='--', alpha=0.5)
plt.tight_layout()
plt.show()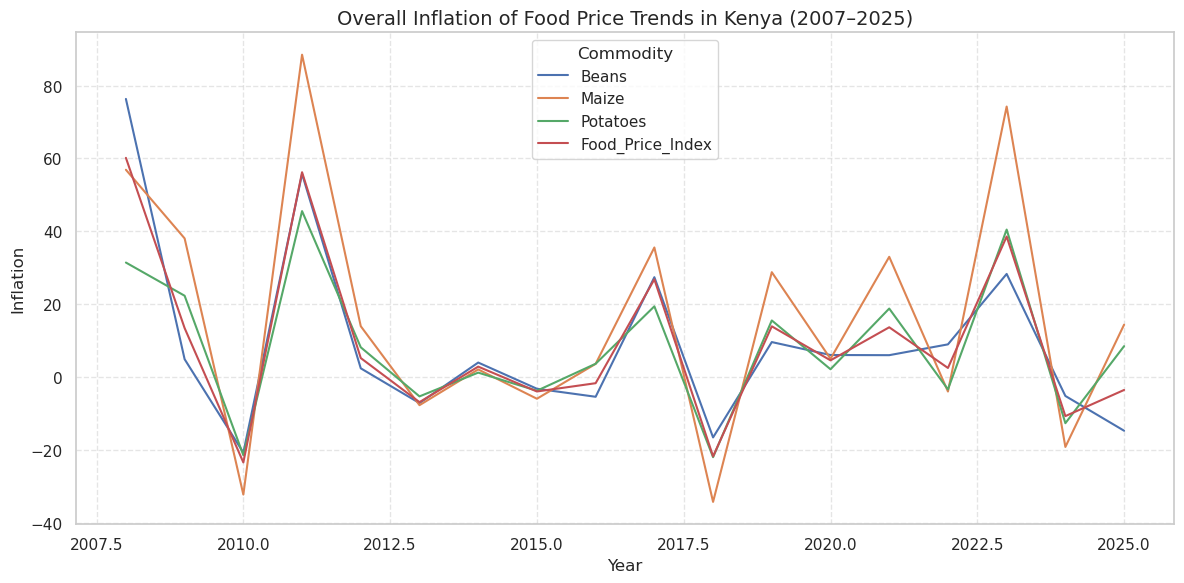 Overall Inflation of Food Price Trends in Kenya (2007–2025)
Starts high (~75% inflation around 2008), drops sharply around 2010, then spikes again.
Shows multiple large swings, especially between 2008–2011 and 2018–2023.
Overall: Significant but less extreme than Maize.
Shows the largest upward spikes in multiple years — particularly around 2011 and 2023, where inflation appears to exceed 80%.
Also dips deeply into the negatives during deflation periods (e.g., around 2010 and 2018).
This suggests the greatest volatility and strong inflation bursts over time.
Experiences moderate fluctuations that largely track with overall inflation trends.
Less extreme peaks and troughs compared to Beans or Maize.
More stable relative to the other commodities.
Averages out the volatility — it’s smoother because it’s an aggregate measure.
| Commodity | Inflation Volatility | Description |
|---|---|---|
| Maize | 🔺 Highest | Sharpest spikes and dips — most volatile inflation trend |
| Beans | ⚖️ Moderate | Noticeable swings but less extreme |
| Potatoes | 🔻 Lowest | More stable trend, closely follows FPI |
monthly_trends_inflation = df.groupby(['year','month'])[['inflation_beans','inflation_maize','inflation_potatoes','inflation_food_price_index']].mean().reset_index()
monthly_trends_inflation| year | month | inflation_beans | inflation_maize | inflation_potatoes | inflation_food_price_index | |
|---|---|---|---|---|---|---|
| 0 | 2007 | 1 | NaN | NaN | NaN | NaN |
| 1 | 2007 | 2 | NaN | NaN | NaN | NaN |
| 2 | 2007 | 3 | NaN | NaN | NaN | NaN |
| 3 | 2007 | 4 | NaN | NaN | NaN | NaN |
| 4 | 2007 | 5 | NaN | NaN | NaN | NaN |
| ... | ... | ... | ... | ... | ... | ... |
| 220 | 2025 | 5 | -9.057609 | 22.855924 | 13.578587 | 2.353641 |
| 221 | 2025 | 6 | -7.747283 | 23.692989 | 13.826576 | 3.386848 |
| 222 | 2025 | 7 | -4.811576 | 22.890707 | 13.708859 | 5.124239 |
| 223 | 2025 | 8 | -19.084457 | 24.098859 | 14.252337 | -2.091304 |
| 224 | 2025 | 9 | -17.393315 | 29.525000 | 17.511087 | 0.410598 |
225 rows × 6 columns
# Make sure month names are properly formatted and ordered
month_order = list(calendar.month_name[1:])
# Convert month column to an ordered categorical type
monthly_trends['month'] = pd.Categorical(monthly_trends['month'],
categories=month_order,
ordered=True)
# pivot will respect that order
pivot = monthly_trends_inflation.pivot(index='year', columns='month', values='inflation_food_price_index')
plt.figure(figsize=(10,6))
sns.heatmap(pivot, cmap='RdYlGn_r', annot=True, fmt=".1f")
plt.title('Seasonal Heatmap of Inflation (Monthly Averages)')
plt.xlabel('Month')
plt.ylabel('Year')
plt.show()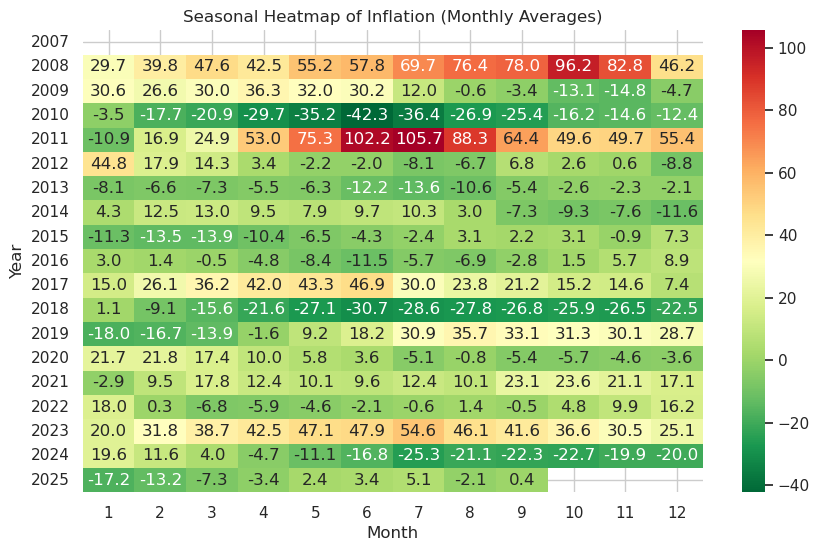 Seasonal Heatmap of Inflation (Monthly Averages)
The heatmap visualizes monthly inflation variations across years, showing how inflation fluctuates seasonally and historically.
| Period | Inflation Behavior | Description |
|---|---|---|
| 2008–2011 | 🔺 Very High | Inflation shocks, peaking in 2011 |
| 2012–2017 | ⚖️ Moderate | Relative stabilization with occasional rises |
| 2018–2019 | 🔻 Low/Negative | Deflation periods across multiple months |
| 2020–2022 | ⚖️ Moderate | Recovery years with slight upward trends |
| 2023–2025 | 🔺 Rising Again | Renewed inflation volatility, mid-year peaks |
🧠 Insight:
Kenya’s inflation demonstrates strong seasonal dependence and external shock sensitivity. The mid-year months (June–August) remain the most inflation-prone, likely tied to agricultural cycles and import-driven costs.
# Group inflation data by province and year
province_inflation = (
    df.groupby(['provinces', 'year'])[
        ['inflation_beans', 'inflation_maize', 'inflation_potatoes', 'inflation_food_price_index']
    ]
    .mean()
    .reset_index()
)

# Calculate volatility (standard deviation) for each province
volatility = (
    province_inflation.groupby('provinces')[
        ['inflation_beans', 'inflation_maize', 'inflation_potatoes', 'inflation_food_price_index']
    ]
    .std()
    .round(2)
    .sort_values(by='inflation_food_price_index', ascending=False)  # Sort overall FPI volatility descending
)

print("\n📊 Inflation Volatility by Province (Standard Deviation):")
print(volatility)

# Identify and display most volatile provinces for each commodity
print("\n🔥 Most Volatile Provinces by Commodity (Descending Order):")
for col in volatility.columns:
    commodity = col.replace('inflation_', '').replace('_', ' ').title()
    sorted_volatility = volatility[col].sort_values(ascending=False)

    print(f"\n{commodity}:")
    print(sorted_volatility.to_string())
    print(f"➡️ Most volatile province: {sorted_volatility.index[0]} (std: {sorted_volatility.iloc[0]:.2f})")
📊 Inflation Volatility by Province (Standard Deviation):
               inflation_beans  inflation_maize  inflation_potatoes  \
provinces
Coast                    24.91            37.48               21.29
Nyanza                   24.79            39.72               20.36
Rift Valley              24.88            34.67               19.62
Eastern                  24.77            34.62               19.57
Central                  24.33            32.34               18.61
North Eastern            24.83            31.75               18.21
Nairobi                  25.11            30.33               17.05

               inflation_food_price_index
provinces
Coast                               24.03
Nyanza                              23.79
Rift Valley                         23.67
Eastern                             23.52
Central                             22.87
North Eastern                       22.87
Nairobi                             22.08

🔥 Most Volatile Provinces by Commodity (Descending Order):

Beans:
provinces
Nairobi          25.11
Coast            24.91
Rift Valley      24.88
North Eastern    24.83
Nyanza           24.79
Eastern          24.77
Central          24.33
➡️ Most volatile province: Nairobi (std: 25.11)

Maize:
provinces
Nyanza           39.72
Coast            37.48
Rift Valley      34.67
Eastern          34.62
Central          32.34
North Eastern    31.75
Nairobi          30.33
➡️ Most volatile province: Nyanza (std: 39.72)

Potatoes:
provinces
Coast            21.29
Nyanza           20.36
Rift Valley      19.62
Eastern          19.57
Central          18.61
North Eastern    18.21
Nairobi          17.05
➡️ Most volatile province: Coast (std: 21.29)

Food Price Index:
provinces
Coast            24.03
Nyanza           23.79
Rift Valley      23.67
Eastern          23.52
Central          22.87
North Eastern    22.87
Nairobi          22.08
➡️ Most volatile province: Coast (std: 24.03)The table below shows how much inflation rates have fluctuated (standard deviation) across Kenyan provinces and commodities.
| Province | Beans | Maize | Potatoes | Food Price Index |
|---|---|---|---|---|
| Coast | 24.91 | 37.48 | 21.29 | 24.03 |
| Nyanza | 24.79 | 39.72 | 20.36 | 23.79 |
| Rift Valley | 24.88 | 34.67 | 19.62 | 23.67 |
| Eastern | 24.77 | 34.62 | 19.57 | 23.52 |
| Central | 24.33 | 32.34 | 18.61 | 22.87 |
| North Eastern | 24.83 | 31.75 | 18.21 | 22.87 |
| Nairobi | 25.11 | 30.33 | 17.05 | 22.08 |
| Commodity | Most Volatile Province | Std. Dev | Observations |
|---|---|---|---|
| Beans | Nairobi | 25.11 | Even volatility across provinces |
| Maize | Nyanza | 39.72 | Highest volatility overall |
| Potatoes | Coast | 21.29 | Moderate, regional supply-driven |
| Food Price Index | Coast | 24.03 | Reflects import sensitivity and logistics costs |
# Group inflation data by province and year
county_inflation = (
    df.groupby(['provinces','counties','year'])[
        ['inflation_beans', 'inflation_maize', 'inflation_potatoes', 'inflation_food_price_index']
    ]
    .mean()
    .reset_index()
)

# Calculate volatility (standard deviation) for each province
volatility = (
    county_inflation.groupby('counties')[
        ['inflation_beans', 'inflation_maize', 'inflation_potatoes', 'inflation_food_price_index']
    ]
    .std()
    .round(2)
    .sort_values(by='inflation_food_price_index', ascending=False)  # Sort overall FPI volatility descending
)

print("\n📊 Inflation Volatility by County (Standard Deviation):")
print(volatility)

# Identify and display most volatile provinces for each commodity
print("\n🔥 Most Volatile County by Commodity (Descending Order):")
for col in volatility.columns:
    commodity = col.replace('inflation_', '').replace('_', ' ').title()
    sorted_volatility = volatility[col].sort_values(ascending=False)

    print(f"\n{commodity}:")
    print(sorted_volatility.to_string())
    print(f"➡️ Most volatile county: {sorted_volatility.index[0]} (std: {sorted_volatility.iloc[0]:.2f})")
📊 Inflation Volatility by County (Standard Deviation):
              inflation_beans  inflation_maize  inflation_potatoes  \
counties
Mombasa                 25.12            44.93               25.15
Kilifi                  25.55            40.62               22.81
Kwale                   24.62            42.49               23.86
Samburu                 24.70            42.81               23.56
Meru South              25.25            41.21               23.09
Meru North              24.73            35.49               20.51
West Pokot              25.13            34.89               20.09
Nakuru                  24.80            41.65               22.18
Marsabit                24.79            36.15               20.56
Kisumu                  24.79            39.72               20.36
Baringo                 24.77            35.43               20.25
Taita Taveta            25.11            34.36               19.65
Isiolo                  24.77            34.27               19.68
Turkana                 25.16            32.75               18.87
Kajiado                 26.17            31.20               17.98
Makueni                 24.95            33.12               19.15
Uasin Gishu             24.28            39.56               28.36
Tana River              24.84            33.14               19.02
Machakos                24.61            32.25               18.62
Wajir                   24.69            32.05               18.37
Garissa                 24.94            31.80               18.24
Nyeri                   24.33            32.34               18.61
Mandera                 24.77            31.45               18.05
Nairobi                 25.11            30.33               17.05
Kitui                   25.15            31.36               15.30

              inflation_food_price_index
counties
Mombasa                            25.31
Kilifi                             24.93
Kwale                              24.83
Samburu                            24.73
Meru South                         24.71
Meru North                         24.25
West Pokot                         23.98
Nakuru                             23.90
Marsabit                           23.84
Kisumu                             23.79
Baringo                            23.77
Taita Taveta                       23.70
Isiolo                             23.56
Turkana                            23.54
Kajiado                            23.48
Makueni                            23.44
Uasin Gishu                        23.43
Tana River                         23.25
Machakos                           22.97
Wajir                              22.92
Garissa                            22.92
Nyeri                              22.87
Mandera                            22.73
Nairobi                            22.08
Kitui                              21.16

🔥 Most Volatile County by Commodity (Descending Order):

Beans:
counties
Kajiado         26.17
Kilifi          25.55
Meru South      25.25
Turkana         25.16
Kitui           25.15
West Pokot      25.13
Mombasa         25.12
Taita Taveta    25.11
Nairobi         25.11
Makueni         24.95
Garissa         24.94
Tana River      24.84
Nakuru          24.80
Kisumu          24.79
Marsabit        24.79
Baringo         24.77
Mandera         24.77
Isiolo          24.77
Meru North      24.73
Samburu         24.70
Wajir           24.69
Kwale           24.62
Machakos        24.61
Nyeri           24.33
Uasin Gishu     24.28
➡️ Most volatile county: Kajiado (std: 26.17)

Maize:
counties
Mombasa         44.93
Samburu         42.81
Kwale           42.49
Nakuru          41.65
Meru South      41.21
Kilifi          40.62
Kisumu          39.72
Uasin Gishu     39.56
Marsabit        36.15
Meru North      35.49
Baringo         35.43
West Pokot      34.89
Taita Taveta    34.36
Isiolo          34.27
Tana River      33.14
Makueni         33.12
Turkana         32.75
Nyeri           32.34
Machakos        32.25
Wajir           32.05
Garissa         31.80
Mandera         31.45
Kitui           31.36
Kajiado         31.20
Nairobi         30.33
➡️ Most volatile county: Mombasa (std: 44.93)

Potatoes:
counties
Uasin Gishu     28.36
Mombasa         25.15
Kwale           23.86
Samburu         23.56
Meru South      23.09
Kilifi          22.81
Nakuru          22.18
Marsabit        20.56
Meru North      20.51
Kisumu          20.36
Baringo         20.25
West Pokot      20.09
Isiolo          19.68
Taita Taveta    19.65
Makueni         19.15
Tana River      19.02
Turkana         18.87
Machakos        18.62
Nyeri           18.61
Wajir           18.37
Garissa         18.24
Mandera         18.05
Kajiado         17.98
Nairobi         17.05
Kitui           15.30
➡️ Most volatile county: Uasin Gishu (std: 28.36)

Food Price Index:
counties
Mombasa         25.31
Kilifi          24.93
Kwale           24.83
Samburu         24.73
Meru South      24.71
Meru North      24.25
West Pokot      23.98
Nakuru          23.90
Marsabit        23.84
Kisumu          23.79
Baringo         23.77
Taita Taveta    23.70
Isiolo          23.56
Turkana         23.54
Kajiado         23.48
Makueni         23.44
Uasin Gishu     23.43
Tana River      23.25
Machakos        22.97
Wajir           22.92
Garissa         22.92
Nyeri           22.87
Mandera         22.73
Nairobi         22.08
Kitui           21.16
➡️ Most volatile county: Mombasa (std: 25.31)This analysis examines the volatility (standard deviation) of inflation rates across Kenyan counties for three staple commodities — beans, maize, and potatoes — as well as the overall food price index.
High standard deviation values indicate greater price instability (volatility).
| County | Beans (σ) | Maize (σ) | Potatoes (σ) | Food Price Index (σ) |
|---|---|---|---|---|
| Mombasa | 25.12 | 44.93 | 25.15 | 25.31 |
| Kilifi | 25.55 | 40.62 | 22.81 | 24.93 |
| Kwale | 24.62 | 42.49 | 23.86 | 24.83 |
| Samburu | 24.70 | 42.81 | 23.56 | 24.73 |
| Meru South | 25.25 | 41.21 | 23.09 | 24.71 |
| Uasin Gishu | 24.28 | 39.56 | 28.36 | 23.43 |
| Kajiado | 26.17 | 31.20 | 17.98 | 23.48 |
| Nairobi | 25.11 | 30.33 | 17.05 | 22.08 |
| Kitui | 25.15 | 31.36 | 15.30 | 21.16 |
(Full data available in appendix section.)
| Commodity | Most Volatile County | Std. Deviation (σ) | Remarks |
|---|---|---|---|
| 🫘 Beans | Kajiado | 26.17 | Strong intra-year fluctuations possibly linked to inconsistent rainfall and market dependency. |
| 🌽 Maize | Mombasa | 44.93 | Extremely volatile due to reliance on external maize inflows and transport disruptions. |
| 🥔 Potatoes | Uasin Gishu | 28.36 | Reflects sensitivity to farming seasons and regional demand spikes. |
| 🍱 Food Price Index | Mombasa | 25.31 | Highest composite volatility, suggesting systemic food market instability. |
High volatility (σ > 25) indicates unstable price environments, where consumers experience frequent and sharp inflation changes.
This instability can signal:
Conversely, lower volatility (σ < 20) reflects stable local food systems with smoother inflation trends.
| County | Beans (σ) | Maize (σ) | Potatoes (σ) | Food Price Index (σ) |
|---|---|---|---|---|
| Mombasa | 25.12 | 44.93 | 25.15 | 25.31 |
| Kilifi | 25.55 | 40.62 | 22.81 | 24.93 |
| Kwale | 24.62 | 42.49 | 23.86 | 24.83 |
| Samburu | 24.70 | 42.81 | 23.56 | 24.73 |
| Meru South | 25.25 | 41.21 | 23.09 | 24.71 |
| Meru North | 24.73 | 35.49 | 20.51 | 24.25 |
| West Pokot | 25.13 | 34.89 | 20.09 | 23.98 |
| Nakuru | 24.80 | 41.65 | 22.18 | 23.90 |
| Marsabit | 24.79 | 36.15 | 20.56 | 23.84 |
| Kisumu | 24.79 | 39.72 | 20.36 | 23.79 |
| Baringo | 24.77 | 35.43 | 20.25 | 23.77 |
| Taita Taveta | 25.11 | 34.36 | 19.65 | 23.70 |
| Isiolo | 24.77 | 34.27 | 19.68 | 23.56 |
| Turkana | 25.16 | 32.75 | 18.87 | 23.54 |
| Kajiado | 26.17 | 31.20 | 17.98 | 23.48 |
| Makueni | 24.95 | 33.12 | 19.15 | 23.44 |
| Uasin Gishu | 24.28 | 39.56 | 28.36 | 23.43 |
| Tana River | 24.84 | 33.14 | 19.02 | 23.25 |
| Machakos | 24.61 | 32.25 | 18.62 | 22.97 |
| Wajir | 24.69 | 32.05 | 18.37 | 22.92 |
| Garissa | 24.94 | 31.80 | 18.24 | 22.92 |
| Nyeri | 24.33 | 32.34 | 18.61 | 22.87 |
| Mandera | 24.77 | 31.45 | 18.05 | 22.73 |
| Nairobi | 25.11 | 30.33 | 17.05 | 22.08 |
| Kitui | 25.15 | 31.36 | 15.30 | 21.16 |
# Group inflation data by province and year
county_inflation = (
    df.groupby(['provinces','counties','mkt_name','year'])[
        ['inflation_beans', 'inflation_maize', 'inflation_potatoes', 'inflation_food_price_index']
    ]
    .mean()
    .reset_index()
)

# Calculate volatility (standard deviation) for each province
volatility = (
    county_inflation.groupby('mkt_name')[
        ['inflation_beans', 'inflation_maize', 'inflation_potatoes', 'inflation_food_price_index']
    ]
    .std()
    .round(2)
    .sort_values(by='inflation_food_price_index', ascending=False)  # Sort overall FPI volatility descending
)

print("\n📊 Inflation Volatility by Market Name (Standard Deviation):")
print(volatility)

# Identify and display most volatile provinces for each commodity
print("\n🔥 Most Volatile Market by Commodity (Descending Order):")
for col in volatility.columns:
    commodity = col.replace('inflation_', '').replace('_', ' ').title()
    sorted_volatility = volatility[col].sort_values(ascending=False)

    print(f"\n{commodity}:")
    print(sorted_volatility.to_string())
    print(f"➡️ Most volatile Market: {sorted_volatility.index[0]} (std: {sorted_volatility.iloc[0]:.2f})")
📊 Inflation Volatility by Market Name (Standard Deviation):
inflation_beans inflation_maize inflation_potatoes \
mkt_name
Kalahari (Mombasa) 25.28 47.54 26.53
Bangladesh (Mombasa) 24.91 47.41 26.48
Moroto (Mombasa) 25.24 46.35 25.91
Shonda (Mombasa) 25.31 46.63 25.85
Porro 25.26 46.06 24.96
... ... ... ...
Kawangware (Nairobi) 25.36 29.82 16.49
Dandora (Nairobi) 25.23 30.07 16.98
Kibra (Nairobi) 24.32 30.17 17.26
Kitui 24.31 31.29 19.71
Nairobi 25.13 30.57 22.33
inflation_food_price_index
mkt_name
Kalahari (Mombasa) 25.88
Bangladesh (Mombasa) 25.80
Moroto (Mombasa) 25.69
Shonda (Mombasa) 25.54
Porro 25.49
... ...
Kawangware (Nairobi) 22.31
Dandora (Nairobi) 22.17
Kibra (Nairobi) 21.91
Kitui 20.44
Nairobi 20.40
[184 rows x 4 columns]
🔥 Most Volatile Market by Commodity (Descending Order):
Beans:
mkt_name
Kakuma 4 26.78
HongKong (Kakuma) 26.32
Kitui town (Kitui) 26.26
Kalobeyei (Village 1) 26.25
Illbissil Food Market (Kajiado) 26.24
Kajiado 26.17
Wayu 26.03
Dadaab town 25.96
Lopur 25.77
Hagadera (Daadab) 25.77
Kakuma 3 25.74
Kalobeyei (Village 2) 25.69
Naduat 25.65
Aposta 25.64
Lolupe 25.64
Saretho 25.62
Mukuru (Nairobi) 25.60
Nanigi 25.57
Ethiopia (Kakuma) 25.55
Kalobeyei (Village 3) 25.55
Kilifi 25.55
Kaeris 25.51
Lokichoggio 25.46
Alinjugur 25.45
Kataboi 25.41
Kangemi (Nairobi) 25.37
Kawangware (Nairobi) 25.36
Eliye Centre 25.36
Dagahaley (Daadab) 25.34
Letea 25.33
Damajale 25.33
Kalokol 25.32
Shonda (Mombasa) 25.31
Kalahari (Mombasa) 25.28
Kakuma 2 25.27
Kongowea (Mombasa) 25.26
Alemsekon 25.26
Porro 25.26
Kaanwa (Tharaka Nithi) 25.25
Shauri Yako 25.24
Moroto (Mombasa) 25.24
Dandora (Nairobi) 25.23
Lorugum 25.22
Namoruputh 25.21
Jarajara 25.21
Loturerei 25.20
Lokitaung 25.19
Lowarengak 25.19
Kokuro 25.18
Kibwezi 25.17
Kaakelai 25.17
Nakinomet 25.16
Kalemunyang 25.16
Kaikor 25.15
Kaleng 25.15
Garbatulla 25.15
Napak 25.15
Lomut (West Pokot) 25.14
Makutano (West Pokot) 25.14
Nairobi 25.13
El Wak 25.13
Lokiriama 25.12
Wakulima (Nairobi) 25.12
Emali 25.12
Mtito Andei 25.11
Kisumu Ndogo (Mombasa) 25.11
Boka 25.10
Tarbaj 25.09
IFO (Daadab) 25.09
Boji 25.06
Kitengela (Kajiado) 25.05
Bangale 25.05
Nakuru 25.04
Garissa town (Garissa) 25.03
Garissa 25.03
Katilia 25.02
Mombasa 25.02
Songa 25.01
Benane 25.01
Elelea 25.01
Dub Goba 25.01
Dirib 25.01
Marsabit 25.00
Marsabit town 25.00
Karare 24.99
Mathare (Nairobi) 24.97
Lokangae 24.97
Kimalel Center 24.96
Merti CENTER 24.95
Takaba (Mandera) 24.94
Suguta 24.94
Nakukulas 24.94
Marigat town (Baringo) 24.93
Mogadishu (Kakuma) 24.92
Chemolingot 24.92
Bangladesh (Mombasa) 24.91
Hadado 24.91
Malka GALLA 24.89
Hola town 24.89
Maralal 24.89
Isiolo town 24.88
Lolkunono 24.88
Nginyang 24.88
Loosuk 24.88
Kalemgorok 24.88
Bilbil 24.87
Kiwanja 24.87
Ngilai 24.87
Ngurunit 24.87
Bura 24.86
Habaswein 24.85
Kathonzweni (Makueni) 24.85
Kisumu 24.85
Saka Town 24.85
Iresaboru Centre 24.84
Lororo Centre 24.83
Makueni 24.83
Kiliwaheri 24.83
Wote town (Makueni) 24.82
Biliqo 24.82
Charidende 24.82
Modogashe 24.82
Bulesa Bulesa 24.81
Lesirkan 24.81
Kargi South Horr 24.81
Amaya 24.80
Oldonyiro 24.80
Koriema 24.79
Junda (Mombasa) 24.79
Korr 24.78
Ashabito 24.77
Laisamis Town 24.77
Bute 24.76
Griftu 24.76
Lodwar town 24.75
Kibuye (Kisumu) 24.73
Morulem 24.73
Kisima 24.73
Lokori 24.72
Lokwii 24.72
Alango Arba 24.72
Loboi Center 24.71
Makere 24.71
Banissa 24.71
Rhamu 24.70
Wamba 24.69
Lokichar (Turkana) 24.68
Malkadaka 24.68
Lolkuniyani 24.68
Loglogo 24.68
Mandera town 24.66
Maalamin 24.66
Mandera 24.66
Loyangalani 24.65
Lokapel 24.64
Merille Town 24.63
Vanga (Kwale) 24.62
Lotubae 24.62
Tala Centre Market (Machakos) 24.61
Shanta Abak 24.61
Marigat (Baringo) 24.61
Liboi 24.61
Ngaremara 24.60
Sericho Center 24.59
Lagbogol 24.57
Eldas 24.56
Wakulima (Nakuru) 24.56
Baraki 24.53
Kipini 24.48
Tarasaa 24.44
Lengusaka 24.42
Lodungokwe 24.42
Kargi 24.42
Kipsing CENTER 24.41
Dertu 24.39
Garsen 24.39
Lpus 24.38
Naakalei 24.37
Karatina (Nyeri) 24.33
Kibra (Nairobi) 24.32
Kitui 24.31
Eldoret town (Uasin Gishu) 24.28
Baragoi 24.27
Wajir town 24.08
➡️ Most volatile Market: Kakuma 4 (std: 26.78)
Maize:
mkt_name
Kalahari (Mombasa) 47.54
Bangladesh (Mombasa) 47.41
Shonda (Mombasa) 46.63
Ngurunit 46.55
Moroto (Mombasa) 46.35
Maralal 46.12
Porro 46.06
Baragoi 45.79
Lolkunono 45.71
Kongowea (Mombasa) 45.58
Loosuk 45.20
Lesirkan 44.83
Junda (Mombasa) 44.79
Merille Town 44.54
Shauri Yako 43.97
Kisumu Ndogo (Mombasa) 43.85
Laisamis Town 43.74
Ngilai 43.29
Lolkuniyani 43.19
Wakulima (Nakuru) 43.11
Kibuye (Kisumu) 42.67
Vanga (Kwale) 42.49
Wamba 42.38
Charidende 41.70
Lengusaka 41.33
Kaanwa (Tharaka Nithi) 41.21
Mombasa 40.97
Nakuru 40.62
Kilifi 40.62
Eldoret town (Uasin Gishu) 39.56
Lpus 38.93
Kisima 38.90
Lodungokwe 38.60
Isiolo town 38.29
Kargi South Horr 37.75
Biliqo 37.63
Suguta 37.50
Bulesa Bulesa 37.35
Kisumu 37.05
Chemolingot 36.70
Korr 36.61
Nginyang 36.53
Malkadaka 36.19
Merti CENTER 36.08
Marigat (Baringo) 36.08
Kiwanja 35.80
Malka GALLA 35.64
Boka 35.53
Loglogo 35.28
Marsabit 35.27
Koriema 35.27
Marigat town (Baringo) 35.24
Ngaremara 35.19
Dub Goba 35.19
Dirib 35.18
Kimalel Center 35.11
Karare 35.10
Lororo Centre 34.96
Makutano (West Pokot) 34.94
Lomut (West Pokot) 34.92
Songa 34.85
Marsabit town 34.81
Iresaboru Centre 34.80
Loboi Center 34.76
Kakuma 3 34.69
Amaya 34.66
Mogadishu (Kakuma) 34.44
Mtito Andei 34.36
Kargi 34.34
Dertu 34.11
Kipsing CENTER 34.06
Kibwezi 33.99
Sericho Center 33.96
Ethiopia (Kakuma) 33.94
Oldonyiro 33.90
Aposta 33.90
Kakuma 4 33.85
Hadado 33.73
Alemsekon 33.65
Lokichoggio 33.58
Emali 33.57
Kipini 33.56
HongKong (Kakuma) 33.54
Lopur 33.53
Kakuma 2 33.48
Lokori 33.44
Lokangae 33.43
Morulem 33.41
Wayu 33.40
Lotubae 33.39
Lokwii 33.32
Tarasaa 33.25
Garissa town (Garissa) 33.23
Kalemgorok 33.16
Elelea 33.13
Damajale 33.12
Bangale 33.11
Garsen 33.04
Katilia 33.01
Nakukulas 32.98
IFO (Daadab) 32.97
Naduat 32.95
Saka Town 32.92
Nanigi 32.90
Lokiriama 32.89
Lolupe 32.88
Kalobeyei (Village 3) 32.81
Garissa 32.80
Napak 32.76
Nakinomet 32.75
Jarajara 32.74
Makueni 32.72
Kaikor 32.71
Wote town (Makueni) 32.71
Kathonzweni (Makueni) 32.71
Namoruputh 32.71
Eldas 32.68
Lokapel 32.66
Naakalei 32.58
Lokichar (Turkana) 32.58
Kaeris 32.52
Loyangalani 32.51
Kaakelai 32.51
Kaleng 32.51
Habaswein 32.45
Lorugum 32.43
Kokuro 32.43
Hola town 32.42
Maalamin 32.36
Karatina (Nyeri) 32.34
Benane 32.34
Boji 32.29
Lokitaung 32.27
Tala Centre Market (Machakos) 32.25
Bute 32.25
Kalemunyang 32.24
Makere 32.19
Kataboi 32.19
Lowarengak 32.19
Garbatulla 32.18
Alango Arba 32.18
Bura 32.15
Letea 32.13
Griftu 32.08
Bilbil 32.00
Tarbaj 32.00
Kalokol 31.98
Liboi 31.94
Baraki 31.87
Modogashe 31.85
Lodwar town 31.84
El Wak 31.83
Loturerei 31.81
Mathare (Nairobi) 31.70
Eliye Centre 31.61
Banissa 31.60
Kiliwaheri 31.59
Alinjugur 31.56
Saretho 31.51
Illbissil Food Market (Kajiado) 31.49
Dadaab town 31.46
Ashabito 31.45
Takaba (Mandera) 31.43
Kitui town (Kitui) 31.43
Mandera town 31.31
Mandera 31.31
Mukuru (Nairobi) 31.30
Rhamu 31.29
Shanta Abak 31.29
Kitui 31.29
Lagbogol 31.28
Dagahaley (Daadab) 31.13
Kalobeyei (Village 1) 31.00
Kajiado 30.98
Kitengela (Kajiado) 30.96
Kalobeyei (Village 2) 30.82
Nairobi 30.57
Wakulima (Nairobi) 30.56
Wajir town 30.53
Kibra (Nairobi) 30.17
Kangemi (Nairobi) 30.11
Dandora (Nairobi) 30.07
Kawangware (Nairobi) 29.82
Hagadera (Daadab) 29.45
➡️ Most volatile Market: Kalahari (Mombasa) (std: 47.54)
Potatoes:
mkt_name
Nakuru 28.77
Eldoret town (Uasin Gishu) 28.36
Kalahari (Mombasa) 26.53
Bangladesh (Mombasa) 26.48
Moroto (Mombasa) 25.91
Shonda (Mombasa) 25.85
Kongowea (Mombasa) 25.35
Ngurunit 25.31
Junda (Mombasa) 25.26
Kisumu 25.02
Baragoi 24.97
Porro 24.96
Lolkunono 24.79
Maralal 24.74
Shauri Yako 24.69
Lesirkan 24.59
Loosuk 24.58
Kisumu Ndogo (Mombasa) 24.55
Merille Town 24.54
Laisamis Town 24.23
Ngilai 23.93
Lolkuniyani 23.88
Vanga (Kwale) 23.86
Charidende 23.57
Wamba 23.46
Mombasa 23.44
Wakulima (Nakuru) 23.33
Kaanwa (Tharaka Nithi) 23.09
Lengusaka 22.93
Kilifi 22.81
Kibuye (Kisumu) 22.42
Nairobi 22.33
Isiolo town 22.08
Lpus 21.83
Kisima 21.76
Lodungokwe 21.66
Kargi South Horr 21.49
Biliqo 21.36
Bulesa Bulesa 21.22
Suguta 21.18
Chemolingot 20.97
Korr 20.86
Nginyang 20.85
Kiwanja 20.68
Malkadaka 20.62
Merti CENTER 20.57
Marigat (Baringo) 20.51
Ngaremara 20.34
Koriema 20.32
Malka GALLA 20.30
Boka 20.29
Lomut (West Pokot) 20.28
Kimalel Center 20.22
Loglogo 20.22
Marigat town (Baringo) 20.14
Marsabit 20.12
Dirib 20.08
Dub Goba 20.08
Karare 20.04
Makutano (West Pokot) 19.99
Lororo Centre 19.99
Iresaboru Centre 19.93
Kakuma 3 19.91
Songa 19.90
Loboi Center 19.85
Marsabit town 19.83
Mogadishu (Kakuma) 19.73
Kitui 19.71
Kargi 19.69
Amaya 19.66
Mtito Andei 19.65
Dertu 19.63
Kipsing CENTER 19.62
Oldonyiro 19.54
Kakuma 4 19.54
Kibwezi 19.52
Sericho Center 19.52
Ethiopia (Kakuma) 19.48
Aposta 19.47
Alemsekon 19.38
Kakuma 2 19.36
Hadado 19.33
Lopur 19.30
Emali 19.28
Lokichoggio 19.26
Kipini 19.24
Lokangae 19.21
Lokori 19.20
Wayu 19.17
Lotubae 19.16
Morulem 19.16
HongKong (Kakuma) 19.14
Lokwii 19.12
Tarasaa 19.10
Bangale 19.09
Kalemgorok 19.08
Elelea 19.04
Garissa town (Garissa) 19.02
Lokiriama 19.02
Kathonzweni (Makueni) 19.01
Makueni 19.01
Wote town (Makueni) 19.00
Lolupe 18.98
Katilia 18.98
Garsen 18.97
Nakukulas 18.96
Saka Town 18.94
Naduat 18.94
Nanigi 18.93
Napak 18.90
Namoruputh 18.90
Nakinomet 18.90
Damajale 18.89
Kalobeyei (Village 3) 18.88
Kaikor 18.88
Garissa 18.80
Lorugum 18.79
IFO (Daadab) 18.79
Kaakelai 18.78
Kaeris 18.78
Lokichar (Turkana) 18.77
Kaleng 18.77
Lokapel 18.74
Jarajara 18.74
Kokuro 18.73
Eldas 18.71
Naakalei 18.69
Kalemunyang 18.66
Loyangalani 18.62
Tala Centre Market (Machakos) 18.62
Karatina (Nyeri) 18.61
Lokitaung 18.60
Hola town 18.60
Boji 18.60
Benane 18.58
Kataboi 18.57
Letea 18.57
Mathare (Nairobi) 18.55
Maalamin 18.54
Lowarengak 18.53
Alango Arba 18.53
Habaswein 18.52
Bute 18.52
Kalokol 18.48
Garbatulla 18.48
Loturerei 18.45
Lodwar town 18.45
Griftu 18.43
Makere 18.38
Modogashe 18.36
Bura 18.35
Tarbaj 18.34
Kitengela (Kajiado) 18.31
Baraki 18.30
El Wak 18.29
Bilbil 18.29
Liboi 18.26
Eliye Centre 18.25
Illbissil Food Market (Kajiado) 18.20
Dadaab town 18.13
Kiliwaheri 18.13
Banissa 18.11
Ashabito 18.04
Shanta Abak 18.03
Alinjugur 18.01
Saretho 18.01
Rhamu 18.00
Mukuru (Nairobi) 18.00
Mandera town 17.99
Mandera 17.99
Kalobeyei (Village 1) 17.97
Takaba (Mandera) 17.97
Lagbogol 17.91
Dagahaley (Daadab) 17.90
Wakulima (Nairobi) 17.90
Kalobeyei (Village 2) 17.85
Kajiado 17.77
Wajir town 17.53
Kibra (Nairobi) 17.26
Dandora (Nairobi) 16.98
Hagadera (Daadab) 16.87
Kangemi (Nairobi) 16.70
Kitui town (Kitui) 16.67
Kawangware (Nairobi) 16.49
➡️ Most volatile Market: Nakuru (std: 28.77)
Food Price Index:
mkt_name
Kalahari (Mombasa) 25.88
Bangladesh (Mombasa) 25.80
Moroto (Mombasa) 25.69
Shonda (Mombasa) 25.54
Porro 25.49
Kongowea (Mombasa) 25.45
Lolkunono 25.24
Maralal 25.24
Shauri Yako 25.22
Wakulima (Nakuru) 25.21
Loosuk 25.18
Kisumu Ndogo (Mombasa) 25.16
Ngurunit 25.08
Ngilai 25.05
Junda (Mombasa) 25.02
Kibuye (Kisumu) 24.98
Lolkuniyani 24.97
Lesirkan 24.96
Merille Town 24.94
Kilifi 24.93
Isiolo town 24.91
Laisamis Town 24.85
Vanga (Kwale) 24.83
Kakuma 4 24.74
Wamba 24.74
Mombasa 24.73
Baragoi 24.71
Kaanwa (Tharaka Nithi) 24.71
Kakuma 3 24.56
HongKong (Kakuma) 24.51
Charidende 24.50
Lengusaka 24.43
Kiwanja 24.37
Lopur 24.23
Kisima 24.23
Ethiopia (Kakuma) 24.18
Kargi South Horr 24.17
Ngaremara 24.13
Aposta 24.08
Biliqo 24.08
Makutano (West Pokot) 24.03
Lpus 24.03
Alemsekon 24.03
Chemolingot 24.02
Bulesa Bulesa 24.02
Suguta 24.01
Wayu 24.01
Lodungokwe 23.99
Kimalel Center 23.95
Lomut (West Pokot) 23.94
Nginyang 23.94
Marigat town (Baringo) 23.92
Korr 23.90
Lokichoggio 23.88
Marsabit 23.88
Dirib 23.87
Dub Goba 23.87
Boka 23.86
Merti CENTER 23.85
Malkadaka 23.85
Kalobeyei (Village 1) 23.84
Nanigi 23.82
Naduat 23.81
Kakuma 2 23.80
Lolupe 23.80
Songa 23.78
Karare 23.78
Malka GALLA 23.76
Koriema 23.76
Lororo Centre 23.75
Marsabit town 23.74
Kalobeyei (Village 3) 23.72
Kibwezi 23.71
Mogadishu (Kakuma) 23.70
Mtito Andei 23.70
Kalobeyei (Village 2) 23.66
Oldonyiro 23.66
Marigat (Baringo) 23.64
Lokangae 23.63
Amaya 23.62
Loglogo 23.61
Loboi Center 23.61
Iresaboru Centre 23.59
Kaeris 23.59
Lokiriama 23.57
Bangale 23.55
Kipsing CENTER 23.53
Namoruputh 23.53
Kajiado 23.52
Elelea 23.52
Kalemgorok 23.51
Nakukulas 23.51
Katilia 23.49
Lorugum 23.49
Kataboi 23.47
Illbissil Food Market (Kajiado) 23.46
Emali 23.45
Eldoret town (Uasin Gishu) 23.43
Letea 23.42
Hadado 23.42
Lokori 23.41
Kathonzweni (Makueni) 23.39
Morulem 23.38
Kalokol 23.38
Kalemunyang 23.38
Napak 23.37
Nakinomet 23.37
Lokwii 23.36
Jarajara 23.36
Kaikor 23.35
Makueni 23.34
Lotubae 23.33
Wote town (Makueni) 23.33
Kaakelai 23.32
Kokuro 23.31
Kaleng 23.31
Eliye Centre 23.30
Saka Town 23.29
Sericho Center 23.28
Dertu 23.28
Garissa town (Garissa) 23.28
Lokitaung 23.27
Kargi 23.27
Garbatulla 23.27
Benane 23.27
Dadaab town 23.27
Nakuru 23.26
Damajale 23.26
Boji 23.25
Kipini 23.25
Lowarengak 23.25
Loturerei 23.24
Lokichar (Turkana) 23.17
Lokapel 23.15
Garissa 23.15
Kisumu 23.13
El Wak 23.13
Tarasaa 23.13
Tarbaj 23.12
Alango Arba 23.11
Loyangalani 23.11
Saretho 23.09
Lodwar town 23.09
Hola town 23.08
IFO (Daadab) 23.05
Maalamin 23.03
Garsen 23.02
Naakalei 23.01
Griftu 22.99
Eldas 22.99
Tala Centre Market (Machakos) 22.97
Alinjugur 22.96
Bute 22.95
Bura 22.93
Habaswein 22.91
Mukuru (Nairobi) 22.91
Bilbil 22.89
Karatina (Nyeri) 22.87
Modogashe 22.84
Makere 22.82
Dagahaley (Daadab) 22.82
Liboi 22.78
Mandera 22.75
Mandera town 22.75
Takaba (Mandera) 22.70
Rhamu 22.68
Lagbogol 22.68
Kiliwaheri 22.68
Ashabito 22.66
Kitui town (Kitui) 22.64
Shanta Abak 22.63
Banissa 22.61
Hagadera (Daadab) 22.58
Mathare (Nairobi) 22.57
Baraki 22.57
Kitengela (Kajiado) 22.46
Wajir town 22.41
Kangemi (Nairobi) 22.40
Wakulima (Nairobi) 22.36
Kawangware (Nairobi) 22.31
Dandora (Nairobi) 22.17
Kibra (Nairobi) 21.91
Kitui 20.44
Nairobi 20.40
➡️ Most volatile Market: Kalahari (Mombasa) (std: 25.88)Top 5 Most Volatile Markets
🌀 Most Volatile Overall: Kakuma 4
Observation:
Top 5 Most Volatile Markets
🌀 Most Volatile Overall: Kalahari (Mombasa)
Observation:
Top 5 Most Volatile Markets
🌀 Most Volatile Overall: Nakuru
Observation:
Top 5 Most Volatile Markets
🌀 Most Volatile Overall: Kalahari (Mombasa)
Observation:
| Region | Typical Volatility Drivers | Notes |
|---|---|---|
| Mombasa (Coast) | Import dependency, port logistics | Highest volatility across all commodities |
| Kakuma (Turkana) | Remote location, aid-market effects | High volatility in beans |
| Rift Valley (Nakuru, Eldoret) | Seasonal production | Highest for potatoes |
| Nairobi | Urban demand stability | Lowest volatility overall |